. 2011 Jul-Aug;6(4):219-28.
doi: 10.1002/cmmi.421. Epub 2010 Nov 30.

A self-calibrating PARACEST MRI contrast agent that detects esterase enzyme activity

Affiliations

A self-calibrating PARACEST MRI contrast agent that detects esterase enzyme activity

Yuguo Li et al. Contrast Media Mol Imaging. 2011 Jul-Aug.

Abstract

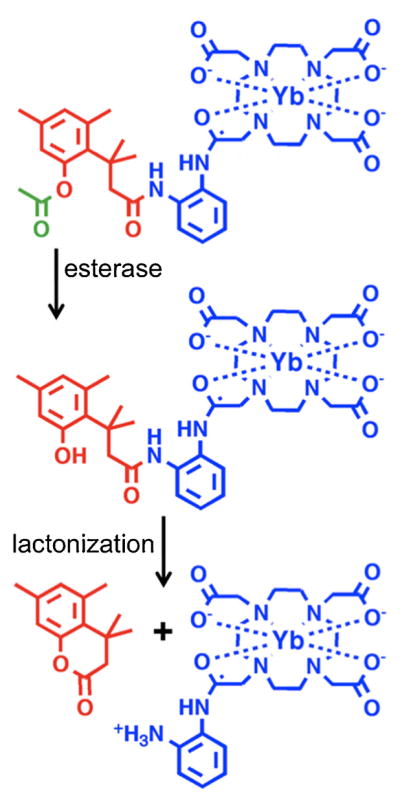
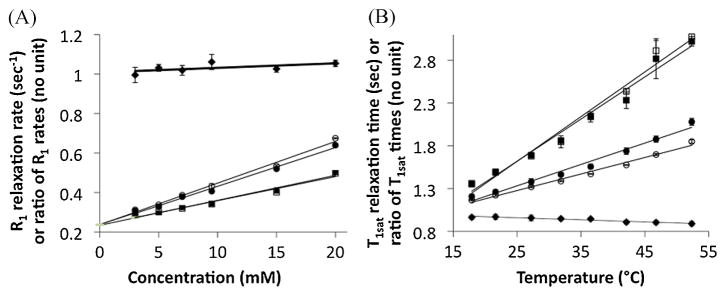
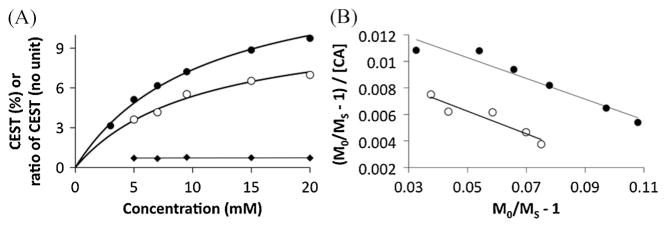
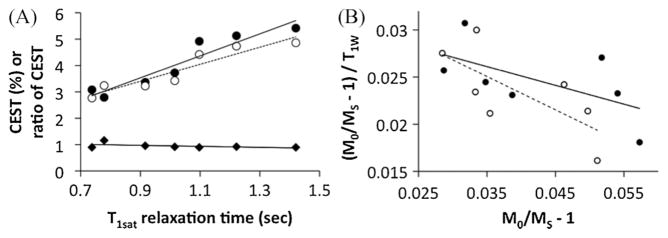
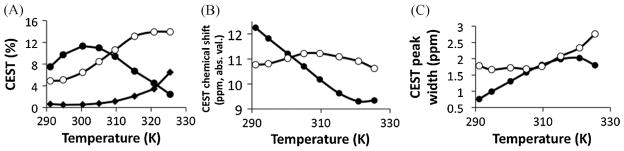
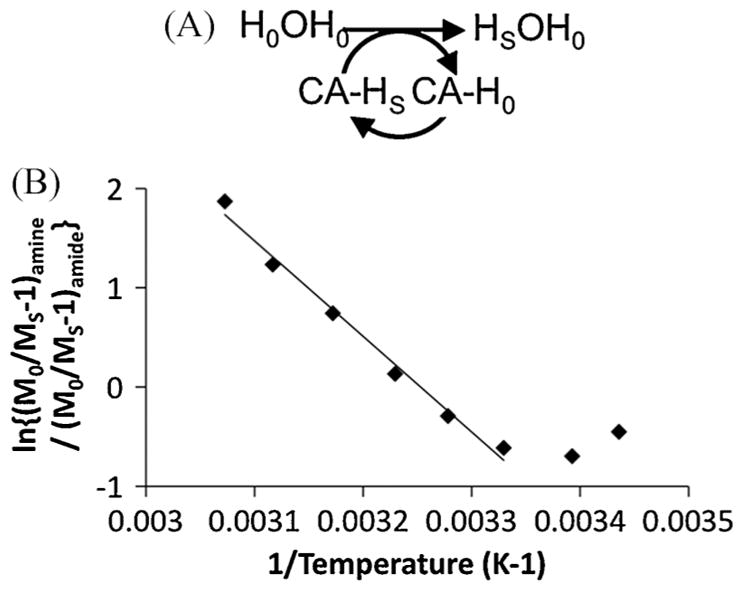
The CEST effect of many PARACEST MRI contrast agents changes in response to a molecular biomarker. However, other molecular biomarkers or environmental factors can influence CEST, so that a change in CEST is not conclusive proof for detecting the biomarker. To overcome this problem, a second control CEST effect may be included in the same PARACEST agent, which is responsive to all factors that alter the first CEST effect except for the biomarker to be measured. To investigate this approach, a PARACEST MRI contrast agent was developed with one CEST effect that is responsive to esterase enzyme activity and a second control CEST effect. The ratio of the two CEST effects was independent of concentration and T(1) relaxation, so that this agent was self-calibrating with respect to these factors. This ratiometric method was dependent on temperature and was influenced by MR coalescence as the chemical exchange rates approached the chemical shifts of the exchangable protons as temperature was increased. The two CEST effects also showed evidence of having different pH dependencies, so that this agent was not self-calibrating with respect to pH. Therefore, a self-calibrating PARACEST MRI contrast agent can more accurately detect a molecular biomarker such as esterase enzyme activity, as long as temperature and pH are within an acceptable physiological range and remain constant.


Figures

Figure 1
Figure 1
The mechanism of esterase enzyme detection. After the ester (green) is cleaved by an esterase enzyme, the tri-methyl lock moiety (red) can undergo lactonization to form a hydrocourmarin and also convert an amide to an amine in the Yb-DO3A-oAA PARACEST MRI contrast agent (blue). The appearance of the CEST effect from this amine is used to detect esterase enzyme activity. The CEST effect of the amide of Yb-DO3A-oAA is used as an internal control.
Figure 2
Figure 2
Synthesis of Yb-DO3A-oAA-TML-ester: (a) 2-bromoacetyl bromide (1.5 equiv.), (CH2CH3)3N (1.5 equiv.), CHCl3, 0 °C, 1 h, r.t., for 30 min, 50%; (b) DO3A-t-Bu-ester (0.7 equiv.), K2CO3 (6 equiv.), acetonitrile, 70 °C, 24 h, 80%; (c) 100% TFA, 6 h, 98%; (d) Pd–C (10%), water, H2 (3 atm), 90%; (e) YbCl3, water (pH 6.0), 60 °C, 2 h, 90%; (f) TML-ester [3-(2′-acetoxy-4′,6′-dimethylphenyl)-3,3-dimethylpropionic acid], EDCl, py/DMF, r.t., 48 h, 38%.
Figure 3
Figure 3
Detection of esterase enzyme activity with a PARACEST agent. Before enzyme catalysis, the control CEST effect was present at −10 ppm (solid circles). The enzyme-responsive CEST effect appeared at 12 ppm (open circles) after (A) adding esterase to 20 mM of Yb-DO3A-oAA-TML-ester, and (B) after incubation of 20 mM of Yb-DO3A-oAA-TML-ester in medium used to culture P. aeruginosa. In both cases, the control CEST effect at −10 ppm was unaffected by the esterase enzymes except for a small decrease in CEST that was attributed to a lower pH of the sample that occurred during de-esterification. Data points are connected by a line to aid visualization of the results, and the line does not represent the Lorentzian lineshapes that were used in the analyses.
Figure 4
Figure 4
Lorentzian line-fitting of a CEST spectrum. (A) A single function that consisted of a sum of three Lorentzian lines (solid line) was fit to the experimental data (solid circles) for a CEST spectrum of 7 mM of Yb-DO3A-oAA. Similar results were obtained from fitting other CEST spectra. (B) The residuals of the fitting routine (experimental data – fitted result, shown as solid circles connected with a line) were negligible near the peaks of the fitted Lorentzian lines for the CEST effects of the amine and amide (shown as solid lines that are peaked at +12 and −10 ppm, respectively).
Figure 5
Figure 5
The T1 relaxation properties of Yb-DO3A-oAA. Results are shown with respect to (A) concentration and (B) temperature for selective saturation of the amide (solid circles) and amine (open circles), and for control studies with no saturation (solid squares) and selective saturation at +80 ppm (open squares). These linear relationships have an r2 correlation coefficient > 0.98. The amine-to-amide ratio is also shown (solid diamonds). Error bars represent the standard deviation of the T1 inversion-recovery data fitting routine, and are smaller than the symbol for many data points. The concentration-dependent ratio of R1sat relaxation rates is relatively constant compared with the rates of the amine or amide.
Figure 6
Figure 6
The dependence of the CEST effect of Yb-DO3A-oAA on concentration for the amide (solid circles) and amine (open circles). (A) The CEST effects of the amine and the amide of Yb-DO3A-oAA each increased with increasing concentration, but the ratio of the CEST effects was insensitive to changes in concentration. (B) The Hanes calibration [eqn (4)] was used to measure the r1sat relaxivities and chemical exchange rates of the agent, and the linearities of each calibration confirmed that the chemical exchange of the amide and amine are sufficiently described by a two-pool model.
Figure 7
Figure 7
(A) The dependence of the CEST effect of Yb-DO3A-oAA on T1W relaxation times for the amide (solid circles, solid line) and amine (open circles, dashed line). (B) The slope and y-intercept of a modification of the Hanes calibration separates the conditions of concentration and chemical exchange rate (kex), respectively. The r2 correlation coefficient is 0.50 and 0.36 for the calibration of the amine and amide, respectively.
Figure 8
Figure 8
The dependence of the CEST effect of Yb-DO3A-oAA on temperature for the amide (solid circles) and amine (open circles) and the amine-to-amide ratio (solid diamonds). Lines that connect the data points are provided as a visual aid. (A) The decreasing CEST effect of the amide with increasing temperatures reflects chemical shift coalescence that leads to incomplete saturation. The plateau of the amine’s CEST effect also indicates evidence for chemical shift coalescence at the highest temperatures. The ratio of the CEST effects is also dependent on temperature, but to a lesser extent especially at or below physiological temperatures (310 K). (B) The chemical shifts of the CEST effects depend on temperature. The absolute value of the chemical shifts is shown to facilitate visualization on one graph. (C) An increase in the CEST peak widths of the amide and amide indicates an increasing chemical exchange rate with increasing temperature (except for the amide at the highest temperature).
Figure 9
Figure 9
A more sophisticated analysis of the dependence of the CEST effect of Yb-DO3A-oAA on temperature. (A) The CEST effect is considered to be a first-order chemical reaction in which the PARACEST agent acts as a catalyst. (B) The plot of eqn (7) shows a linear relationship between 27.2 and 53.2 °C, indicating that the ratio of concentrations of the saturated amine and amide is constant within this temperature range.

Similar articles

Cited by

References

    1. Zhang S, Merritt M, Woesner DE, Lenkinski RE, Sherry AD. PARA-CEST agents: modulating MRI contrast via water proton exchange. Acc Chem Res. 2003;36(10):783–790. - PubMed
    1. Yoo B, Pagel MD. An overview of responsive MRI contrast agents for molecular imaging. Front Bioscience. 2008;13:1733–1752. - PubMed
    1. Ali MM, Liu G, Shah T, Flask CA, Pagel MD. Using two chemical exchange saturation transfer magnetic resonance imaging contrast agents for molecular imaging studies. Acc Chem Res. 2009;42(7):915–924. - PMC - PubMed
    1. Ward KM, Balaban RS. Determination of pH using water protons and chemical exchange dependent saturation transfer (CEST) Magn Reson Med. 2000;44(5):799–802. - PubMed
    1. Aime S, Barge A, Delli Castelli D, Fedeli F, Mortillaro A, Nielsen FU, Terreno E. Paramagnetic lanthanide(III) complexes as pH-sensitive chemical exchange saturation transfer (CEST) contrast agents for MRI applications. Magn Reson Med. 2002;47:639–648. - PubMed

Publication types

MeSH terms