

Physiogenomic analysis of CYP450 drug metabolism correlates dyslipidemia with pharmacogenetic functional status in psychiatric patients
- PMID: 21861666
- PMCID: PMC3225002
- DOI: 10.2217/bmm.11.33
Physiogenomic analysis of CYP450 drug metabolism correlates dyslipidemia with pharmacogenetic functional status in psychiatric patients
Abstract
Aims: To investigate associations between novel human cytochrome P450 (CYP450) combinatory (multigene) and substrate-specific drug metabolism indices, and elements of metabolic syndrome, such as low density lipoprotein cholesterol (LDLc), high density lipoprotein cholesterol (HDLc), triglycerides and BMI, using physiogenomic analysis.
Methods: CYP2C9, CYP2C19 and CYP2D6 genotypes and clinical data were obtained for 150 consecutive, consenting hospital admissions with a diagnosis of major depressive disorder and who were treated with psychotropic medications. Data analysis compared clinical measures of LDLc, HDLc, triglyceride and BMI with novel combinatory and substrate-specific CYP450 drug metabolism indices.
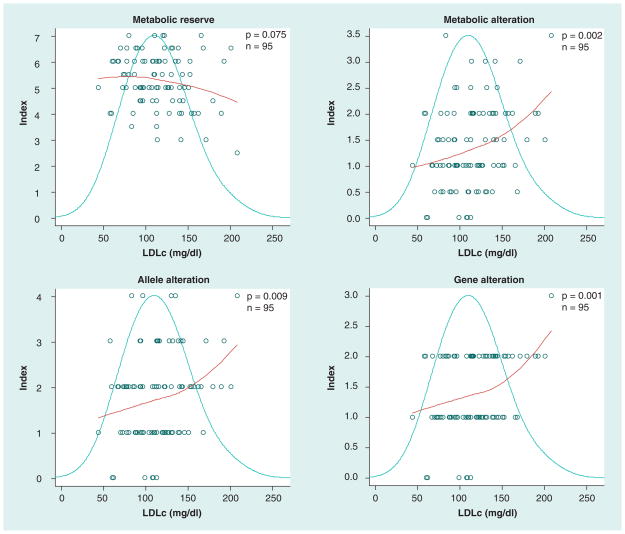
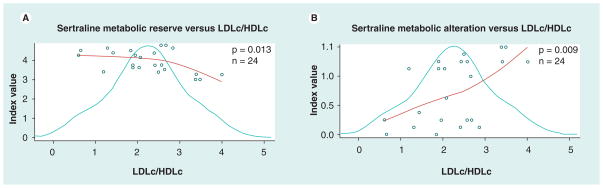
Results: We found that a greater metabolic reserve index score is related to lower LDLc and higher HDLc, and that a greater metabolic alteration index score corresponds with higher LDLc and lower HLDc values. We also discovered that the sertraline drug-specific indices correlated with cholesterol and triglyceride values.
Conclusions: Overall, we demonstrated how a multigene approach to CYP450 genotype analysis yields more accurate and significant results than single-gene analyses. Ranking the individual with respect to the population represents a potential tool for assessing risk of dyslipidemia in major depressive disorder patients who are being treated with psychotropics. In addition, the drug-specific indices appear useful for modeling a variable of potential relevance to an individual's risk of drug-related dyslipidemia.
Figures

References
-
- Newcomer JW. Second-generation (atypical) antipsychotics and metabolic effects: a comprehensive literature review. CNS Drugs. 2005;19(Suppl 1):1–93. - PubMed
-
- Newcomer JW, Haupt DW. The metabolic effects of antipsychotic medications. Can J Psychiatry. 2006;51(8):480–491. - PubMed
-
- Goethe JW, Szarek BL, Woolley SB, Caley CF. Metabolic abnormalities in psychiatric inpatients. Presented at: American Psychiatric Association meeting; San Diego, CA, USA. 19–24 May 2007.
-
- Goethe JW. Metabolic syndrome in psychiatric inpatients receiving antipsychotics. Presented at: American Psychiatric Association meeting; Atlanta, GA, USA. 21–26 May 2005.
-
- Goethe JW, Szarek BL, Caley CF, et al. Signs and symptoms associated with the metabolic syndrome in psychiatric inpatients receiving antipsychotics: a retrospective chart review. J Clin Psychiatry. 2007;68(1):22–28. - PubMed
Publication types
MeSH terms
Substances
Grants and funding
LinkOut - more resources
Full Text Sources
Other Literature Sources