. 2011 Aug 23:11:105.
doi: 10.1186/1471-2377-11-105.

Metabolic changes in concussed American football players during the acute and chronic post-injury phases

Affiliations

Metabolic changes in concussed American football players during the acute and chronic post-injury phases

Luke C Henry et al. BMC Neurol. .

Abstract

Background: Despite negative neuroimaging findings many athletes display neurophysiological alterations and post-concussion symptoms that may be attributable to neurometabolic alterations.

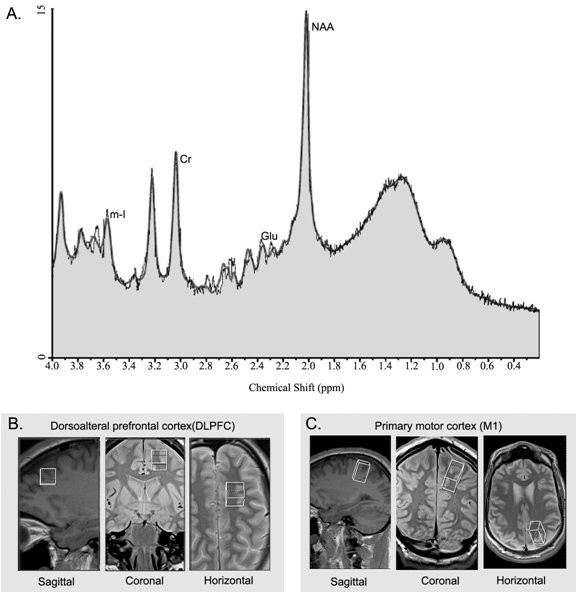
Methods: The present study investigated the effects of sports concussion on brain metabolism using 1H-MR Spectroscopy by comparing a group of 10 non-concussed athletes with a group of 10 concussed athletes of the same age (mean: 22.5 years) and education (mean: 16 years) within both the acute and chronic post-injury phases. All athletes were scanned 1-6 days post-concussion and again 6-months later in a 3T Siemens MRI.

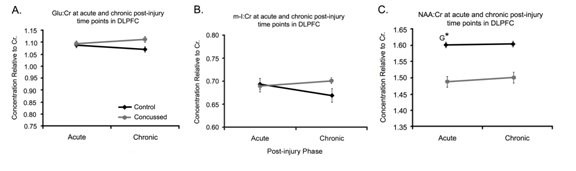
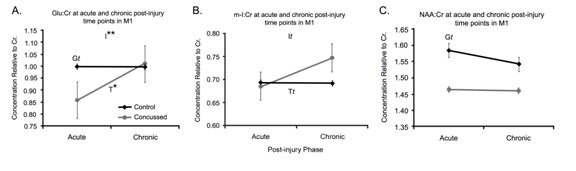
Results: Concussed athletes demonstrated neurometabolic impairment in prefrontal and motor (M1) cortices in the acute phase where NAA:Cr levels remained depressed relative to controls. There was some recovery observed in the chronic phase where Glu:Cr levels returned to those of control athletes; however, there was a pathological increase of m-I:Cr levels in M1 that was only present in the chronic phase.

Conclusions: These results confirm cortical neurometabolic changes in the acute post-concussion phase as well as recovery and continued metabolic abnormalities in the chronic phase. The results indicate that complex pathophysiological processes differ depending on the post-injury phase and the neurometabolite in question.


Figures

Figure 1
Figure 1
Typical spectrum and regions of interest. A. Proton spectrum of a control subject in M1 showing the peaks corresponding to the metabolites of interest, creatine (Cr), myo-inositol (mI), glutamate (Glu), and N-acetylaspartate (NAA). Concentrations are derived from the area under the peaks. B. Regions of interest (ROI) for MRS data acquisition depicted in the sagittal, coronal, and axial planes in the dorsolateral prefrontal cortex (DLPFC) (middle; 16 mm × 16 mm × 16 mm), and C. primary motor cortex (M1) (bottom; 16 mm × 20 mm × 32 mm). Spectra were recorded in both the left and right hemispheres.
Figure 2
Figure 2
Spectra in DLPFC. A. Line graph of the mean Glu/Cr ratios, B. represents the means of m-I:Cr ratios and C. represents NAA:Cr ratios for control (black lines, n = 10) and concussed (gray bars, n = 10) athletes in the dorsolateral prefrontal cortex (DLPFC) at the acute and chronic post injury time points. Values are the mean of 24 voxel spectra (10 left hemisphere, 10 right hemisphere) per group. Standard errors of the means are represented by vertical bars. G represents a group effect and an asterisk indicates a statistically significant difference of p ≤ 0.05.
Figure 3
Figure 3
Spectra in M1. A Line graph of the mean Glu/Cr ratios, B represents the means of m-I:Cr ratios and C. represents NAA:Cr ratios for control (black lines, n = 10) and concussed (gray bars, n = 10) athletes in the dorsolateral prefrontal cortex (DLPFC) at the acute and chronic post injury time points. Values are the mean of 24 voxel spectra (10 left hemisphere, 10 right hemisphere) per group. Standard errors of the means are represented by vertical bars. I represents an interaction of Group and Time, T represents an effect of time, and G represents a group effect. Statistically, t represents a trend where p ≤ .10 and an asterisk indicates a statistically significant difference of p ≤ 0.05 and a double asterisks indicates p ≤ .01.

Similar articles

Cited by

References

    1. Fazio VC, Lovell MR, Pardini JE, Collins MW. The relation between post concussion symptoms and neurocognitive performance in concussed athletes. NeuroRehabilitation. 2007;22:207–216. - PubMed
    1. Lovell MR, Pardini JE, Welling J, Collins MW, Bakal J, Lazar N, Roush R, Eddy WF, Becker JT. Functional brain abnormalities are related to clinical recovery and time to return-to-play in athletes. Neurosurgery. 2007;61:352–359. doi: 10.1227/01.NEU.0000279985.94168.7F. discussion 359-360. - DOI - PubMed
    1. Chen JK, Johnston KM, Frey S, Petrides M, Worsley K, Ptito A. Functional abnormalities in symptomatic concussed athletes: an fMRI study. Neuroimage. 2004;22:68–82. doi: 10.1016/j.neuroimage.2003.12.032. - DOI - PubMed
    1. De Beaumont L, Theoret H, Mongeon D, Messier J, Leclerc S, Tremblay S, Ellemberg D, Lassonde M. Brain function decline in healthy retired athletes who sustained their last sports concussion in early adulthood. Brain. 2009;132:695–708. doi: 10.1093/brain/awn347. - DOI - PubMed
    1. Chen SH, Kareken DA, Fastenau PS, Trexler LE, Hutchins GD. A study of persistent post-concussion symptoms in mild head trauma using positron emission tomography. J Neurol Neurosurg Psychiatry. 2003;74:326–332. doi: 10.1136/jnnp.74.3.326. - DOI - PMC - PubMed

Publication types