. 2011 Aug 24:2:17.
doi: 10.1186/2041-9139-2-17.

A comparative gene expression database for invertebrates

Affiliations

A comparative gene expression database for invertebrates

Mattias Ormestad et al. Evodevo. .

Abstract

Background: As whole genome and transcriptome sequencing gets cheaper and faster, a great number of 'exotic' animal models are emerging, rapidly adding valuable data to the ever-expanding Evo-Devo field. All these new organisms serve as a fantastic resource for the research community, but the sheer amount of data, some published, some not, makes detailed comparison of gene expression patterns very difficult to summarize - a problem sometimes even noticeable within a single lab. The need to merge existing data with new information in an organized manner that is publicly available to the research community is now more necessary than ever.

Description: In order to offer a homogenous way of storing and handling gene expression patterns from a variety of organisms, we have developed the first web-based comparative gene expression database for invertebrates that allows species-specific as well as cross-species gene expression comparisons. The database can be queried by gene name, developmental stage and/or expression domains.

Conclusions: This database provides a unique tool for the Evo-Devo research community that allows the retrieval, analysis and comparison of gene expression patterns within or among species. In addition, this database enables a quick identification of putative syn-expression groups that can be used to initiate, among other things, gene regulatory network (GRN) projects.


Figures

Figure 1
Figure 1
Chart defining developmental stages and expression domains in N. vectensis. (A) The twelve main developmental stages of Nematostella vectensis, according to [24, 25*, 26], Duboc unpublished, *raised at 18°C) and the developmental time required to reach them (in hours post fertilization (hpf), days (d) or month (m)) depending on the temperature of rearing. (B) Schematic representations of the developmental stages indicated in (A) with focus on characteristic stage specific anatomical features and a proposed expression domain nomenclature in order to homogenize database entries. All stages are profile views oriented according to the axis key represented at the bottom of the figure. The nomenclature of the later stage replaces its younger equivalent. For example Animal Plate (AnPl) at the early gastrula stage replaces the term Animal pole (An) at the Blastula stage (both presumptive endoderm). (AbEc) Aboral Ectoderm, (AbHe) Aboral Hemisphere, (An) Animal pole, (AnHe) Animal Hemisphere, (An/Or) Animal/Oral, (AnPl) Animal Plate, (At) Apical tuft, (AtEc) Apical tuft Ectoderm, (AtEn) Apical tuft Endoderm, (BwEc) Bodywall Ectoderm, (BwEn) Bodywall Endoderm, (En) Endoderm, (Ecto) Ectoderm, (L) Left, (M) Mouth, (MeEc) (Mesentery Ectoderm, (MeEn) Mesentery Endoderm, (NSiS) Non-Siphonoglyph Side, (OrEc) Oral Ectoderm, (OrHe) Oral Hemisphere, (pEn) presumptive Endoderm, (PhEc) Pharyngeal Ectoderm, (PhEn) Pharyngeal Endoderm, (R) Right, (Si) Siphonoglyph, (SiS) Siphonoglyph Side, (TeB) Tentacle Bud, (TeBa) Tentacle Base, (TeEc) Tentacle Ectoderm, (TeEn) Tentacle Endoderm, (TeTi) Tentacle Tip, (Ve) Vegetal pole, (Ve/Ab), Vegetal/Aboral, (VeHe) Vegetal Hemisphere.
Figure 2
Figure 2
Database query. Each panel corresponds to one individual webpage. (A) the introduction screen with (1) a search window, (2) general information about the database, (3) recently added species, (4) published genes and (5) laboratories that have contributed gene expression patterns. At this point the user can search a gene expression pattern by entering a single gene name and query in one or all available species simultaneously. (B) the advanced search feature for all species (default setting), where the user can search a gene expression pattern by (i) gene name, (ii) developmental stage and/or (iii) expression domain(s). Note that in this case only parent stages (for example gastrula) or parent expression domains (for example ectoderm) are shown for the sake of comparison. If one specific species is selected all sub-stages (for example mid-gastrula) and all sub-domains (for example pharyngeal ectoderm) are shown and can be used for the advanced search (more details about the advance search are shown in Figure 5).
Figure 3
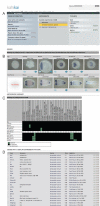
Figure 3
Result page. The output for Nematostella vectensis otxB. This particular entry shows in situ experiments on wild-type embryos. (A) General information about gene, species, author, relevant publications and the experiments. (B) Image view of the gene expression pattern. Images representing the same stage (same or different view) can be visualized by clicking on the blue arrows at the bottom of each picture. (C) This gene expression pattern is also represented in a table view (developmental stages versus expression domain) where the colored cells represent the following information. White: no data available; Black: No expression detected; Green: Expression. (D) The software suggests a list of similarly expressed genes.
Figure 4
Figure 4
Cross species query by gene name. (A) In its current state, searching otx expression patterns in all species will lead to a list of eight entries; one from Ptychodera flava (Hemichordata), three from Nematostella vectensis (Cnidria), two from Parahyle hawaiensis (Ecdysozoa), one from Fungia scutaria (Cnidria) and one from Terebratalia transversa (Spiralia). (B) The comparison table for all genes reveals the stages in which more than two species share a similar expression domain of otx. Clicking on a yellow square will open a new window in which the expression patterns of the given species are shown (similar to Figure 5).
Figure 5
Figure 5
Species-specific gene expression patterns comparison, (A) The default output of this comparison (in this example Nematostella vectensis otxA, otxB and otxC) is a comparison table (developmental stages versus expression domain). Green cells indicate co-expression of the selected genes at a given stage in a given domain, yellow cells indicate that more than one of the selected genes are co-expressed (if more than two expression patterns are compared) and orange cells indicate that only one gene is expressed. Black and white cells indicate no expression or no data available respectively. (B) By clicking on a green cell the images corresponding to the three genes sharing an expression pattern at a give stage appear in a new window. (C) Final view of a single gene expression pattern showing the gene expression information and experimental data.
Figure 6
Figure 6
Species-specific advanced search. (A) A detailed list of all defined developmental stages and expression domains (to reduce the size of the figure some have been omitted) is available for a species-specific advanced search (in this case Nematostella vectensis). By selecting the stage(s) and domain(s) of interest (in this example animal plate (presumptive endoderm) at the blastula stage, indicated by green circles) the user will retrieve (B) a list of genes that fulfill the search criteria. (C) Comparison table obtained after selecting all genes of the result list with a score of one. All green cells indicate that indeed the identified genes are co-expressed in the same domain at the same stage, while their expressions differ in other stages (orange and yellow cells). (D) Clicking on the green cell (in this case the blastula stage), will open a new window in which all blastula stages of the given genes are shown allowing the user to verify the information directly on the submitted images.
Figure 7
Figure 7
Organizing functional data. (A) Per default, a compilation of all wild-type expression patterns (indicated by the yellow bar) is shown in the result page (in this example Paracentrotus lividus nova1). If selecting the Experiment button in (A) the details of the given experiment are un-collapsed (B) offering the option to select between the control (wild-type), or the experimental condition (treatment, injection). In a new window the user will then see the in situ hybridization carried out on treated embryos with the gene of interest including the experimental details (LiCl 15 mM in this case).

Similar articles

Cited by

References

    1. Sprague J, Bayraktaroglu L, Clements D. et al.The Zebrafish Information Network: the zebrafish model organism database. Nucleic Acids Res. 2006;34:D581–D585. doi: 10.1093/nar/gkj086. - DOI - PMC - PubMed
    1. Heinrich T, Ramialison M, Wittbrodt B. et al.MEPD: a resource for medaka gene expression patterns. Bioinformatics. 2005;21:3195–3197. doi: 10.1093/bioinformatics/bti478. - DOI - PubMed
    1. Tomancak P, Berman BP, Beaton A. et al.Global analysis of patterns of gene expression during Drosophila embryogenesis. Genome Biol. 2007;8:R145. doi: 10.1186/gb-2007-8-7-r145. - DOI - PMC - PubMed
    1. Grumbling G, Strelets V. FlyBase: anatomical data, images and queries. Nucleic Acids Res. 2006;34:D484–D488. doi: 10.1093/nar/gkj068. - DOI - PMC - PubMed
    1. Finger JH, Smith CM, Hayamizu TF. et al.The mouse Gene Expression Database (GXD): 2011 update. Nucleic Acids Res. 2011;39:D835–D841. doi: 10.1093/nar/gkq1132. - DOI - PMC - PubMed