

What do expression dynamics tell us about the mechanism of transcription?
- PMID: 21862317
- PMCID: PMC3475196
- DOI: 10.1016/j.gde.2011.07.010
What do expression dynamics tell us about the mechanism of transcription?
Abstract
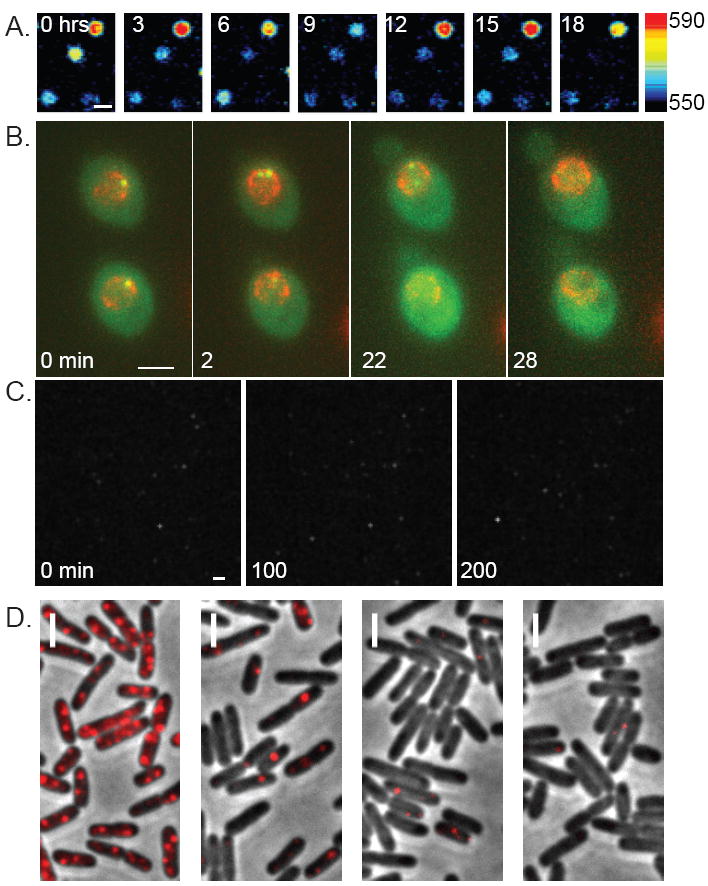
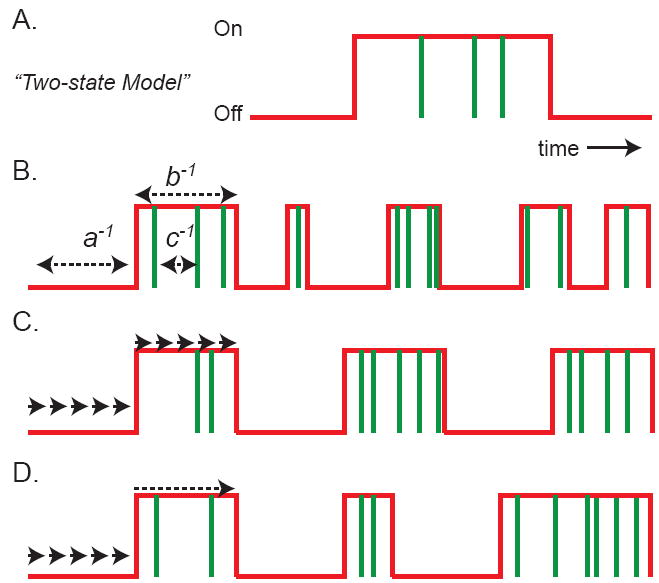
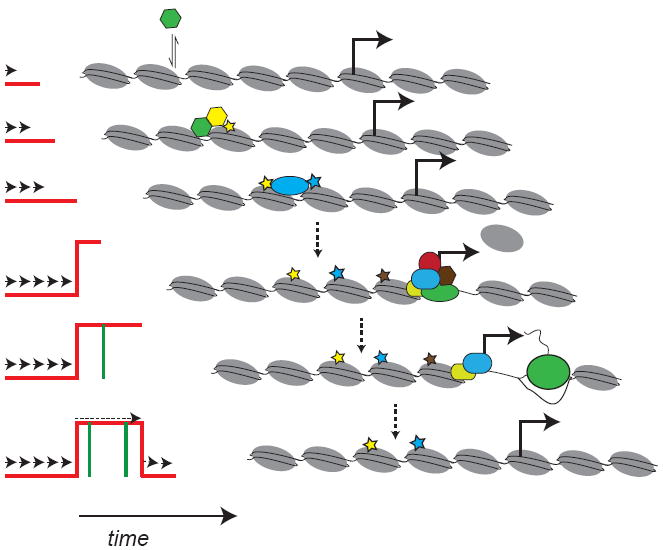
Single-cell microscopy studies have the potential to provide an unprecedented view of gene expression with exquisite spatial and temporal sensitivity. However, there is a challenge to connect the holistic cellular view with a reductionist biochemical view. In particular, experimental efforts to characterize the in vivo regulation of transcription have focused primarily on measurements of the dynamics of transcription factors and chromatin modifying factors. Such measurements have elucidated the transient nature of many nuclear interactions. In the past few years, experimental approaches have emerged that allow for interrogation of the output of transcription at the single-molecule, single-cell level. Here, I summarize the experimental results and models that aim to provide an integrated view of transcriptional regulation.
Published by Elsevier Ltd.
Figures
Similar articles
-
Combinatorial probabilistic chromatin interactions produce transcriptional heterogeneity.J Cell Sci. 2009 Feb 1;122(Pt 3):345-56. doi: 10.1242/jcs.035865. Epub 2009 Jan 6. J Cell Sci. 2009. PMID: 19126674 Free PMC article.
-
The global and promoter-centric 3D genome organization temporally resolved during a circadian cycle.Genome Biol. 2021 Jun 8;22(1):162. doi: 10.1186/s13059-021-02374-3. Genome Biol. 2021. PMID: 34099014 Free PMC article.
-
Single-molecule imaging for investigating the transcriptional control.Mol Cells. 2025 Feb;48(2):100179. doi: 10.1016/j.mocell.2025.100179. Epub 2025 Jan 13. Mol Cells. 2025. PMID: 39814141 Free PMC article. Review.
-
The Emerging Roles of Multimolecular G-Quadruplexes in Transcriptional Regulation and Chromatin Organization.Acc Chem Res. 2024 Dec 3;57(23):3397-3406. doi: 10.1021/acs.accounts.4c00574. Epub 2024 Nov 18. Acc Chem Res. 2024. PMID: 39555660 Free PMC article.
-
Time will tell: comparing timescales to gain insight into transcriptional bursting.Trends Genet. 2024 Feb;40(2):160-174. doi: 10.1016/j.tig.2023.11.003. Epub 2024 Jan 12. Trends Genet. 2024. PMID: 38216391 Free PMC article. Review.
Cited by
-
Effect of Interaction between Chromatin Loops on Cell-to-Cell Variability in Gene Expression.PLoS Comput Biol. 2016 May 6;12(5):e1004917. doi: 10.1371/journal.pcbi.1004917. eCollection 2016 May. PLoS Comput Biol. 2016. PMID: 27153118 Free PMC article.
-
Transcription factors modulate c-Fos transcriptional bursts.Cell Rep. 2014 Jul 10;8(1):75-83. doi: 10.1016/j.celrep.2014.05.053. Epub 2014 Jun 26. Cell Rep. 2014. PMID: 24981864 Free PMC article.
-
Divergence and selectivity of expression-coupled histone modifications in budding yeasts.PLoS One. 2014 Jul 9;9(7):e101538. doi: 10.1371/journal.pone.0101538. eCollection 2014. PLoS One. 2014. PMID: 25007273 Free PMC article.
-
What can we learn when fitting a simple telegraph model to a complex gene expression model?PLoS Comput Biol. 2024 May 14;20(5):e1012118. doi: 10.1371/journal.pcbi.1012118. eCollection 2024 May. PLoS Comput Biol. 2024. PMID: 38743803 Free PMC article.
-
Structure of silent transcription intervals and noise characteristics of mammalian genes.Mol Syst Biol. 2015 Jul 27;11(7):823. doi: 10.15252/msb.20156257. Mol Syst Biol. 2015. PMID: 26215071 Free PMC article.
References
-
- So L-h, Ghosh A, Zong C, Sepulveda LA, Segev R, Golding I. General properties of transcriptional time series in Escherichia coli. Nat Genet. 2011 advance online publication. These authors examined expression levels for 20 different promoters in bacteria using single molecule FISH. They observed that expression level is varied by modulating the gene off-rate, resulting in a change in the duration of transcriptional bursts. The generality of this observation across many different genes suggests that the observed two-state kinetics involves non-specific features such as DNA topology rather than off-rate of a sequence-specific DNA-binding factor. - PMC - PubMed
Publication types
MeSH terms
Grants and funding
LinkOut - more resources
Full Text Sources
Miscellaneous
