

Increased bone mass in mice after single injection of anti-receptor activator of nuclear factor-kappaB ligand-neutralizing antibody: evidence for bone anabolic effect of parathyroid hormone in mice with few osteoclasts
- PMID: 21862583
- PMCID: PMC3196100
- DOI: 10.1074/jbc.M111.246280
Increased bone mass in mice after single injection of anti-receptor activator of nuclear factor-kappaB ligand-neutralizing antibody: evidence for bone anabolic effect of parathyroid hormone in mice with few osteoclasts
Abstract
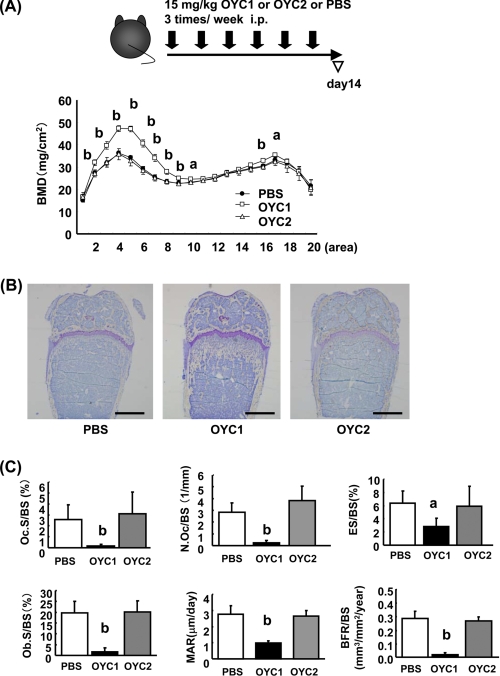
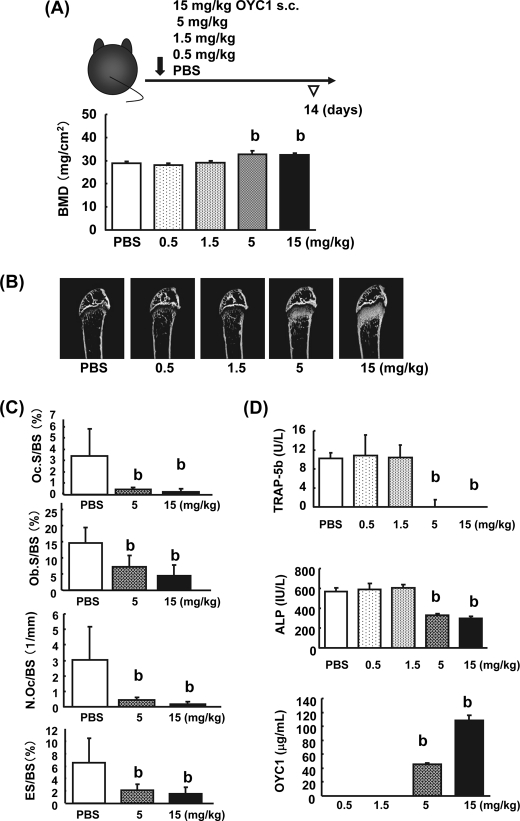
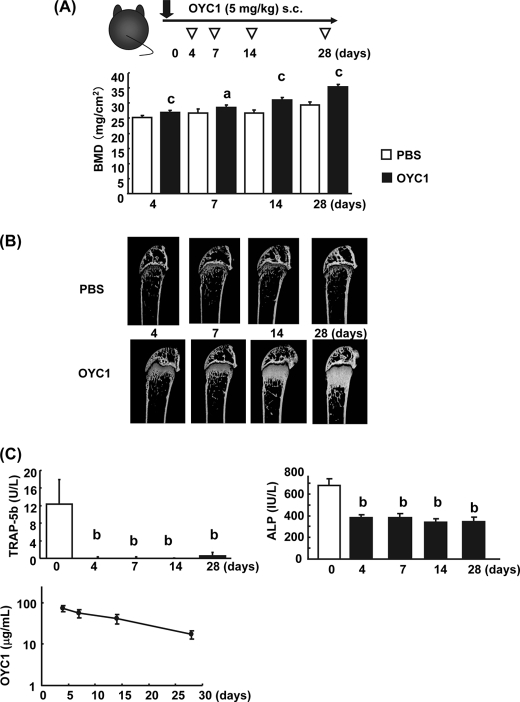
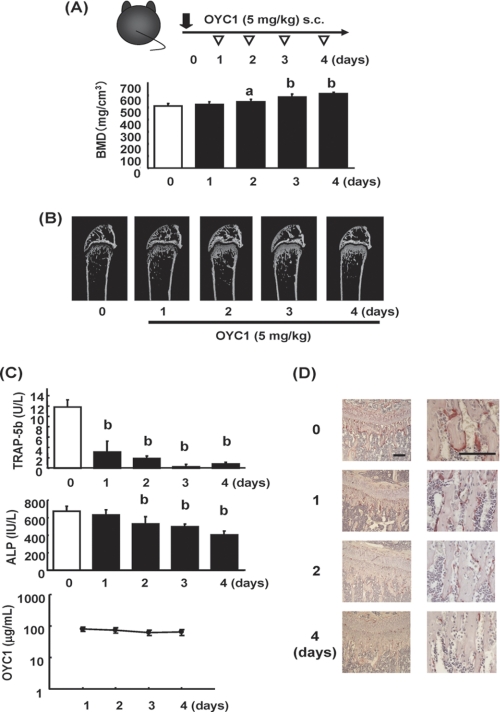
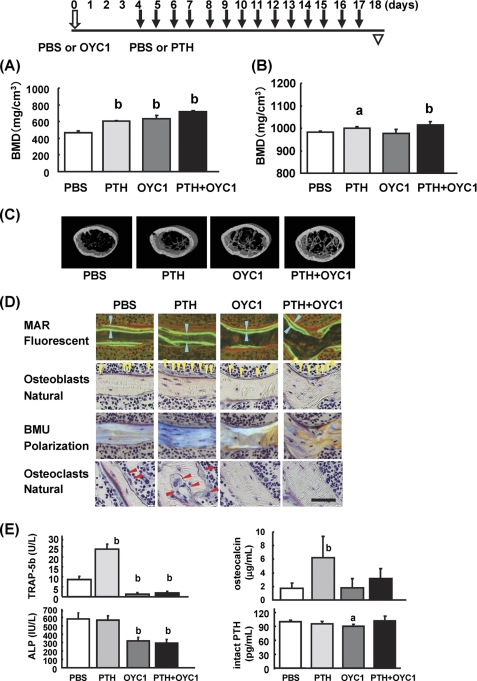
Receptor activator of nuclear factor-κB ligand (RANKL) is a pivotal osteoclast differentiation factor. To investigate the effect of RANKL inhibition in normal mice, we prepared an anti-mouse RANKL-neutralizing monoclonal antibody (Mab, clone OYC1) and established a new mouse model with high bone mass induced by administration of OYC1. A single subcutaneous injection of 5 mg/kg OYC1 in normal mice significantly augmented the bone mineral density in the distal femoral metaphysis from day 2 to day 28. The OYC1 treatment markedly reduced the serum level of tartrate-resistant acid phosphatase-5b (TRAP-5b, a marker for osteoclasts) on day 1, and this level was undetectable from day 3 to day 28. The serum level of alkaline phosphatase (a marker for osteoblasts) declined significantly following the reduction of TRAP-5b. Histological analysis revealed few osteoclasts in femurs of the treated mice on day 4, and both osteoclasts and osteoblasts were markedly diminished on day 14. Daily injection of parathyroid hormone for 2 weeks increased the bone mineral density in trabecular and cortical bone by stimulating bone formation in the OYC1-treated mice. These results suggest that parathyroid hormone exerted its bone anabolic activity in mice with few osteoclasts. The mouse anti-RANKL neutralizing antibody OYC1 may be a useful tool to investigate unknown functions of RANKL in vivo.
Figures
Similar articles
-
Anabolic action of parathyroid hormone is skeletal site specific at the tissue and cellular levels in mice.J Bone Miner Res. 2002 May;17(5):808-16. doi: 10.1359/jbmr.2002.17.5.808. J Bone Miner Res. 2002. PMID: 12009011
-
Stimulation of bone formation in cortical bone of mice treated with a receptor activator of nuclear factor-κB ligand (RANKL)-binding peptide that possesses osteoclastogenesis inhibitory activity.J Biol Chem. 2013 Feb 22;288(8):5562-71. doi: 10.1074/jbc.M112.426080. Epub 2013 Jan 14. J Biol Chem. 2013. PMID: 23319583 Free PMC article.
-
The cross-talk between osteoclasts and osteoblasts in response to strontium treatment: involvement of osteoprotegerin.Bone. 2011 Dec;49(6):1290-8. doi: 10.1016/j.bone.2011.08.031. Epub 2011 Sep 9. Bone. 2011. PMID: 21925296
-
Giant osteoclasts after long-term bisphosphonate therapy: diagnostic challenges.Nat Rev Rheumatol. 2009 Jun;5(6):341-6. doi: 10.1038/nrrheum.2009.87. Nat Rev Rheumatol. 2009. PMID: 19491914 Free PMC article. Review.
-
Phytochemical Compounds Involved in the Bone Regeneration Process and Their Innovative Administration: A Systematic Review.Plants (Basel). 2023 May 22;12(10):2055. doi: 10.3390/plants12102055. Plants (Basel). 2023. PMID: 37653972 Free PMC article. Review.
Cited by
-
Mouse anti-RANKL antibody delays oral wound healing and increases TRAP-positive mononuclear cells in bone marrow.Clin Oral Investig. 2016 May;20(4):727-36. doi: 10.1007/s00784-015-1550-0. Epub 2015 Aug 9. Clin Oral Investig. 2016. PMID: 26254598 Free PMC article.
-
Reduced bone formation and increased bone resorption drive bone loss in Eimeria infected broilers.Sci Rep. 2023 Jan 12;13(1):616. doi: 10.1038/s41598-023-27585-5. Sci Rep. 2023. PMID: 36635321 Free PMC article.
-
Suppression of osteoclastogenesis through phosphorylation of eukaryotic translation initiation factor 2 alpha.J Bone Miner Metab. 2013 Nov;31(6):618-28. doi: 10.1007/s00774-013-0450-0. Epub 2013 Mar 28. J Bone Miner Metab. 2013. PMID: 23536193
-
Conditional inactivation of Blimp1 in adult mice promotes increased bone mass.J Biol Chem. 2012 Aug 17;287(34):28508-17. doi: 10.1074/jbc.M112.356634. Epub 2012 Jul 3. J Biol Chem. 2012. PMID: 22761448 Free PMC article.
-
Genetic interactions between polycystin-1 and Wwtr1 in osteoblasts define a novel mechanosensing mechanism regulating bone formation in mice.Bone Res. 2023 Oct 26;11(1):57. doi: 10.1038/s41413-023-00295-4. Bone Res. 2023. PMID: 37884491 Free PMC article.
References
-
- Lacey D. L., Timms E., Tan H. L., Kelley M. J., Dunstan C. R., Burgess T., Elliott R., Colombero A., Elliott G., Scully S., Hsu H., Sullivan J., Hawkins N., Davy E., Capparelli C., Eli A., Qian Y. X., Kaufman S., Sarosi I., Shalhoub V., Senaldi G., Guo J., Delaney J., Boyle W. J. (1998) Cell 93, 165–176 - PubMed
-
- Nakagawa N., Kinosaki M., Yamaguchi K., Shima N., Yasuda H., Yano K., Morinaga T., Higashio K. (1998) Biochem. Biophys. Res. Commun. 253, 395–400 - PubMed
-
- Hsu H., Lacey D. L., Dunstan C. R., Solovyev I., Colombero A., Timms E., Tan H. L., Elliott G., Kelley M. J., Sarosi I., Wang L., Xia X. Z., Elliott R., Chiu L., Black T., Scully S., Capparelli C., Morony S., Shimamoto G., Bass M. B., Boyle W. J. (1999) Proc. Natl. Acad. Sci. U.S.A. 96, 3540–3545 - PMC - PubMed
-
- Simonet W. S., Lacey D. L., Dunstan C. R., Kelley M., Chang M. S., Lüthy R., Nguyen H. Q., Wooden S., Bennett L., Boone T., Shimamoto G., DeRose M., Elliott R., Colombero A., Tan H. L., Trail G., Sullivan J., Davy E., Bucay N., Renshaw-Gegg L., Hughes T. M., Hill D., Pattison W., Campbell P., Sander S., Van G., Tarpley J., Derby P., Lee R., Boyle W. J. (1997) Cell 89, 309–319 - PubMed
MeSH terms
Substances
LinkOut - more resources
Full Text Sources
Other Literature Sources
Medical
Molecular Biology Databases
