. 2011 Sep 1;71(17):5932-40.
doi: 10.1158/0008-5472.CAN-11-1553. Epub 2011 Aug 23.

Novel cryo-imaging of the glioma tumor microenvironment reveals migration and dispersal pathways in vivid three-dimensional detail

Affiliations

Novel cryo-imaging of the glioma tumor microenvironment reveals migration and dispersal pathways in vivid three-dimensional detail

Susan M Burden-Gulley et al. Cancer Res. .

Abstract

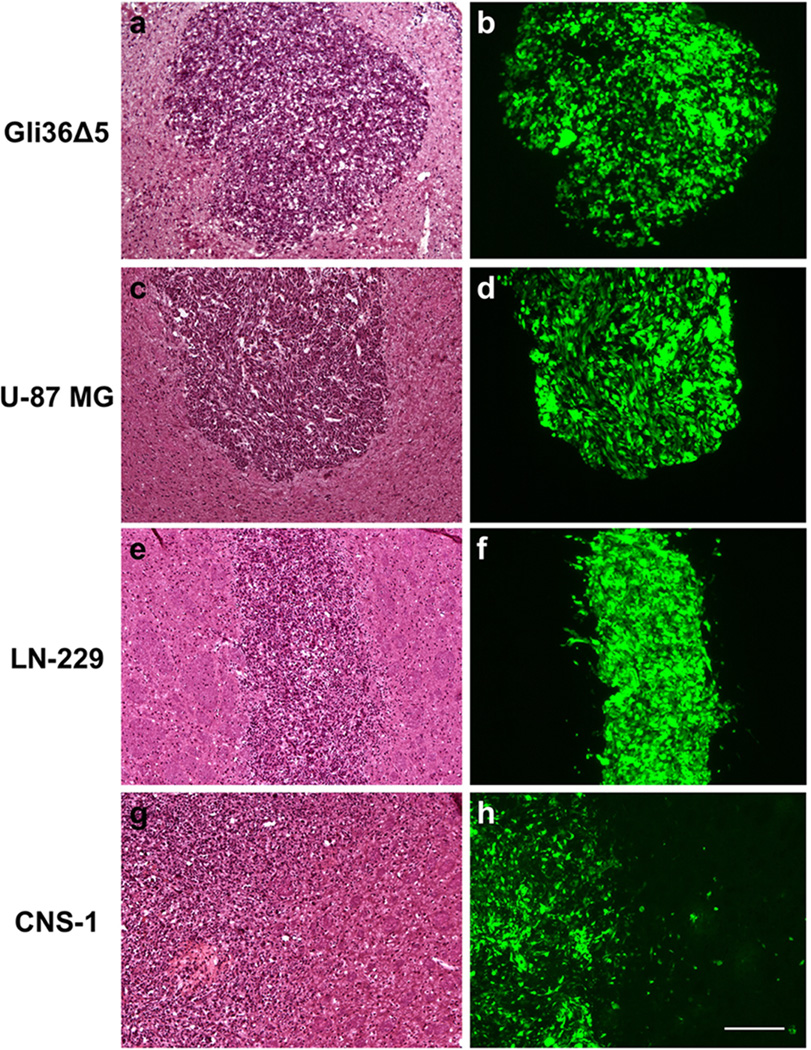
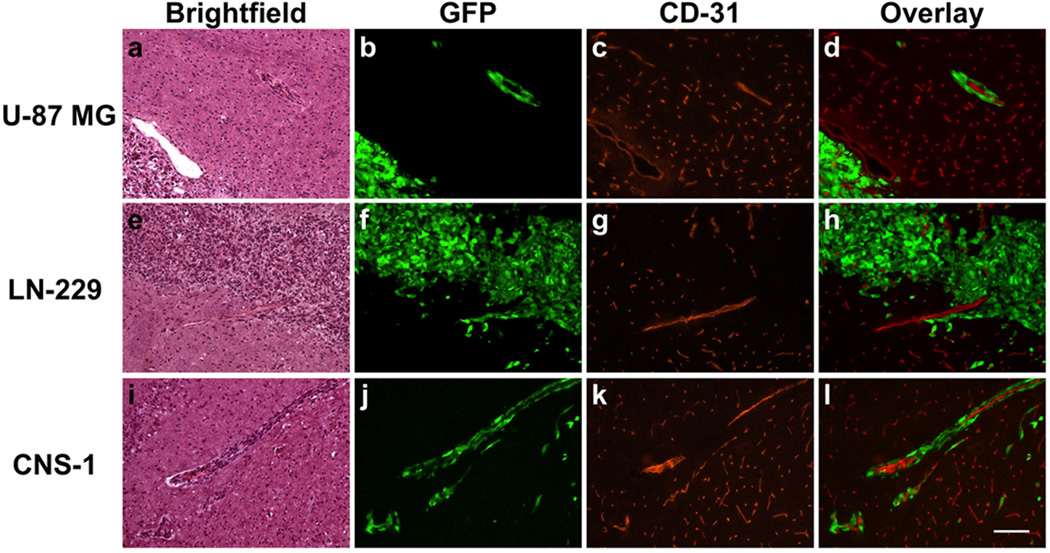
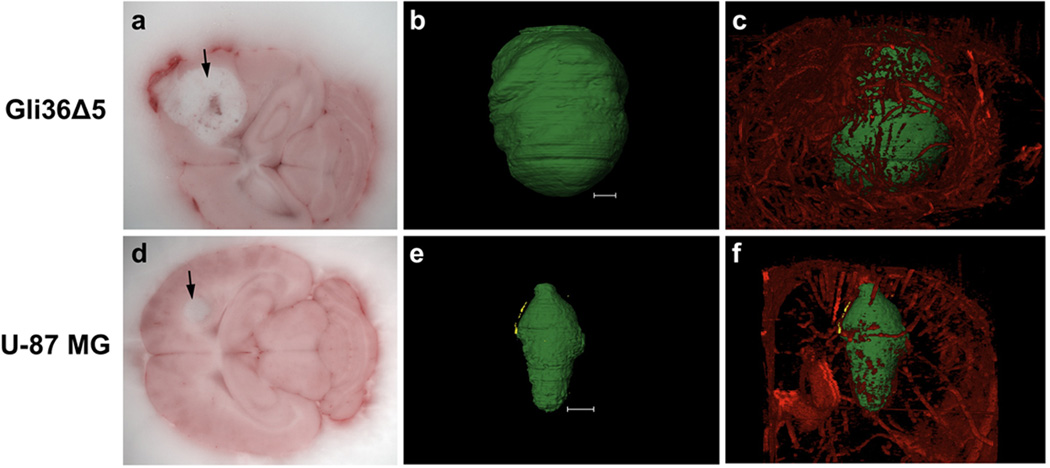
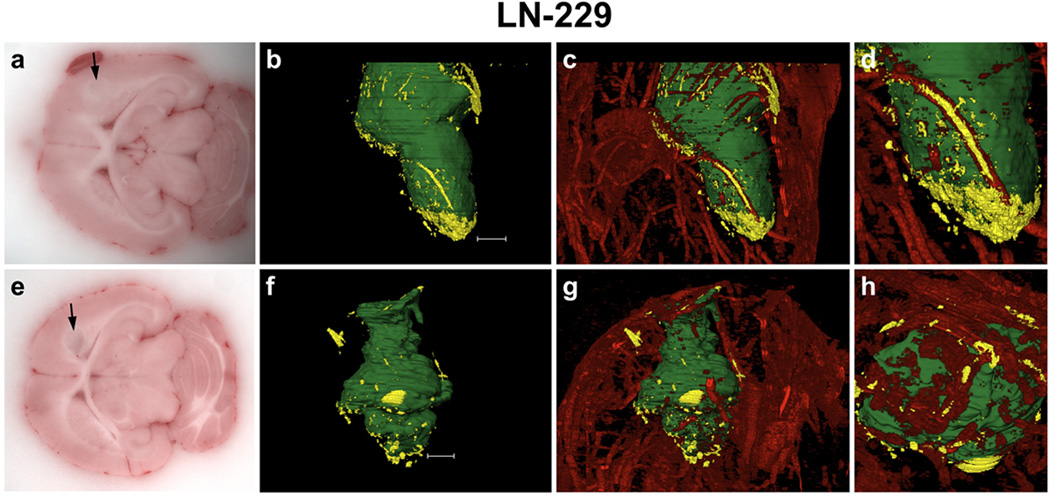
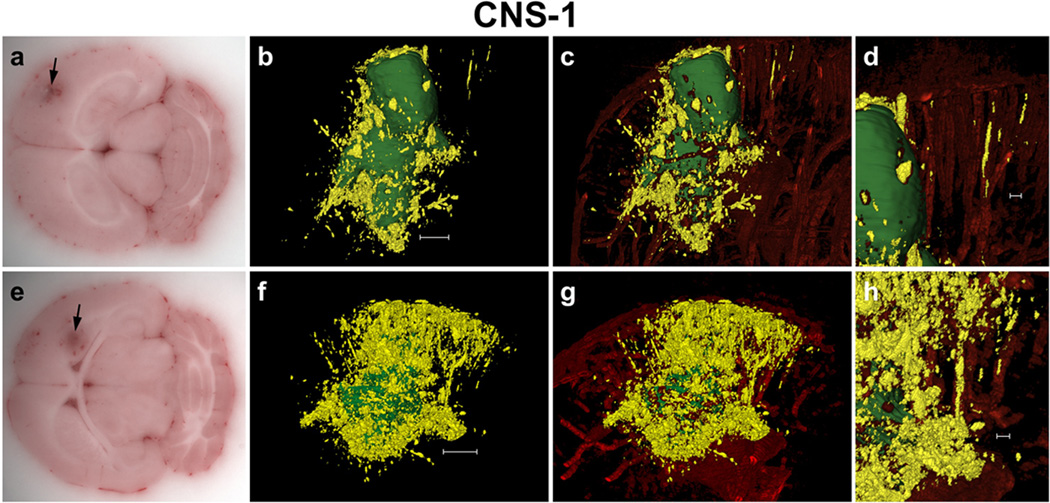
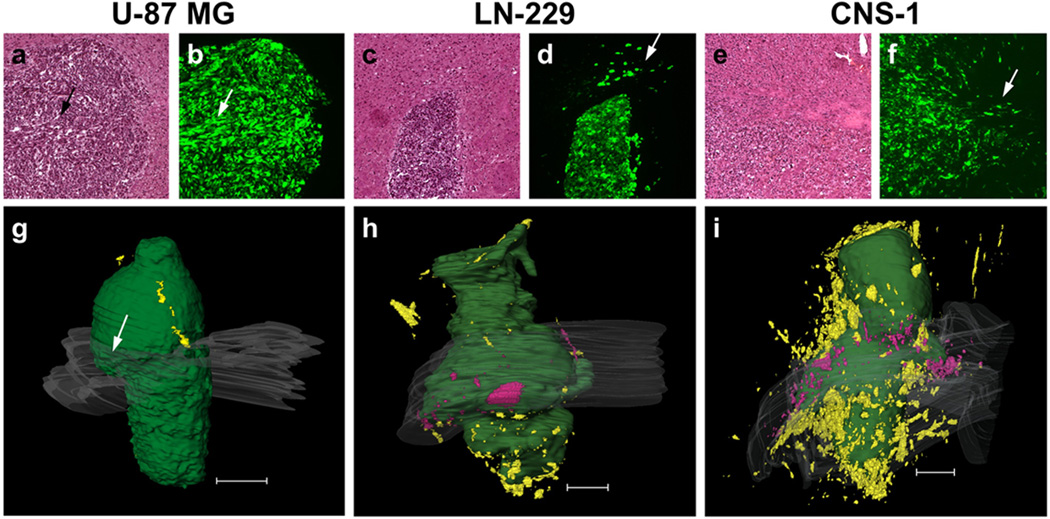
Traditional methods of imaging cell migration in the tumor microenvironment include serial sections of xenografts and standard histologic stains. Current molecular imaging techniques suffer from low resolution and difficulty in imaging through the skull. Here we show how computer algorithms can be used to reconstruct images from tissue sections obtained from mouse xenograft models of human glioma and can be rendered into three-dimensional images offering exquisite anatomic detail of tumor cell dispersal. Our findings identify human LN-229 and rodent CNS-1 glioma cells as valid systems to study the highly dispersive nature of glioma tumor cells along blood vessels and white matter tracts in vivo. This novel cryo-imaging technique provides a valuable tool to evaluate therapeutic interventions targeted at limiting tumor cell invasion and dispersal.


Conflict of interest statement

Conflict of interest: Dr. Wilson has a financial interest in BioInVision Inc., which intends to commercialize cryo-imaging.

Figures

Figure 1
Figure 1
Glioblastoma xenograft tumor growth characteristics in 2-D. Histologic sections of GFP-expressing tumor xenografts of Gli36Δ5 (a, b), U-87 MG (c, d), LN-229 (e, f) or CNS-1 cells (g, h) were stained with hematoxylin and eosin to demarcate the tumor borders within the brain parenchyma. Gli36Δ5 (a, b) and U-87 MG (c, d) cells remain tightly associated within encapsulated tumors. Cells disperse along the length of LN-229 tumors (e, f). CNS-1 tumors consist of more loosely associated cells that migrate readily through the brain parenchyma (g, h). Scale bar represents 200 µm.
Figure 2
Figure 2
Tumor cell dispersal on blood vessels in 2-D. Histologic sections of GFP-expressing tumor xenografts of U-87 MG (a–d), LN-229 (e–h) and CNS-1 (i–l) cells were immunolabeled with the endothelial cell specific antibody CD-31 (c, g, k). Brightfield images from the same tissue sections stained with hematoxylin and eosin are shown in (a, e, and i). U-87 MG cells (a–d) dispersed along blood vessels that were in close proximity to the main tumor. In contrast, LN-229 (e–h) and CNS-1 (i–l) cells dispersed as streams of cells along vessels, often great distances from the main tumor mass. Scale bar represents 100 µm.
Figure 3
Figure 3
3-D reconstruction of Gli36Δ5 and U-87 MG tumors indicates limited cell dispersal. Mouse brains containing xenografts of GFP-expressing Gli36Δ5 (a–c) or U-87 MG (d–f) cells were cryo-imaged and reconstructed in 3-D to show the main tumor mass (pseudo-colored green), dispersed tumor cells (pseudo-colored yellow) and vasculature (pseudo-colored red). 2-D block face images are shown in (a, d), with the tumor indicated by an arrow. 3-D reconstruction of the same brain specimens shows that no cell dispersal was observed from the Gli36Δ5 tumor despite its large size (b, c). In contrast, cells from the U-87 MG tumor dispersed on a nearby blood vessel (e, f). Scale bars represent 500 µm.
Figure 4
Figure 4
3-D reconstruction of LN-229 tumors demonstrates cell dispersal on blood vessels in the tumor microenvironment. Mouse brains containing xenografts of GFP-expressing LN-229 glioma cells were cryo-imaged and reconstructed in 3-D to show tumor (pseudo-colored green), dispersed tumor cells (pseudo-colored yellow) and vasculature features (pseudo-colored red). Examples of 4 week (a–d) and 6 week (e–h) LN-229 tumors are shown. 2-D block face images are shown in (a, e), with the tumor indicated by an arrow. 3-D reconstruction of the same specimens illustrates cell dispersal from several regions of the tumors (b, f). Cell dispersal primarily occurred along major blood vessels in close proximity to the tumors (c, g). Panel D shows a higher power view of the tumor shown in (c). Panel H shows a higher power view of the top of the tumor shown in (g). Note the clustering of dispersed cells on multiple blood vessels. Scale bars represent 500 µm in (b, f) and 100 µm in (d, h).
Figure 5
Figure 5
3-D reconstruction of CNS-1 tumors demonstrates they are highly dispersive along blood vessels. Mouse brains containing seven day xenografts of GFP-expressing CNS-1 glioma cells were cryo-imaged and reconstructed in 3-D to show the main tumor mass (pseudo-colored green), dispersed tumor cells (pseudo-colored yellow) and vasculature (pseudo-colored red). Two examples of CNS-1 tumors are shown (a–h). 2-D block face images are shown in (a, e), with the tumor indicated by an arrow. Vascular density and hemorrhaging within the tumor are visible (a, e). 3-D reconstruction of the same specimens illustrates dramatic cell dispersal from all surfaces of the tumors (b, f). CNS-1 cells were typically clustered on blood vessels near the tumor surface, and dispersed along vessels (c, g, h), to great distances away from the main tumor mass (d). Scale bars represent 500 µm in (b, f) and 100 µm in (d, h). See also Supplementary video 1 for reconstruction of CNS-1 cell dispersal around the entire perimeter of the main tumor.
Figure 6
Figure 6
3-D reconstruction of U-87 MG, LN-229 and CNS-1 cell dispersal on white matter tracts in the brain. Histologic sections from mouse brains containing xenografts of GFP-expressing U-87 MG (b) LN-229 (d) or CNS-1 (f) glioma cells were examined for cell dispersal. Brightfield images from the same tissue sections stained with hematoxylin and eosin are shown in (a), (c) and (e), respectively. U-87 MG cells within the main tumor realigned along the longitudinal axis of the corpus callosum (a, b), a major white matter tract in the brain. However, individual cells did not disperse onto the white matter. LN-229 cells separated from the main tumor to disperse as single cells on the corpus callosum (d). The cells of a CNS-1 tumor were more loosely associated, but were observed to reorient to align with the corpus callosum for dispersal (f). Mouse brains containing xenografts of GFP-expressing U-87 MG (g), LN-229 (h), or CNS-1 (i) glioma cells were cryo-imaged and reconstructed in 3-D to show the main tumor mass (pseudo-colored green), dispersed tumor cells (pseudo-colored yellow) and white matter of the corpus callosum (pseudo-colored gray). Dispersed cells in contact with white matter were pseudo-colored magenta (h, i). Scale bars represent 500 µm. See also Supplementary video 2 for a detailed view of cell dispersal on white matter from a CNS-1 tumor.

Similar articles

Cited by

References

    1. Burger PC, Scheithauer BW, Vogel FS. Surgical pathology of the nervous system and its coverings. 3rd ed. New York: Wiley; 2002.
    1. Brat DJ, Castellano-Sanchez AA, Hunter SB, Pecot M, Cohen C, Hammond EH, et al. Pseudopalisades in glioblastoma are hypoxic, express extracellular matrix proteases, and are formed by an actively migrating cell population. Cancer Res. 2004;64:920–927. - PubMed
    1. Iacob G, Dinca EB. Current data and strategy in glioblastoma multiforme. J Med Life. 2009;2:386–393. - PMC - PubMed
    1. Scherer HJ. Structural development in gliomas. Am J Cancer. 1938;34:333–348.
    1. Nakada M, Nakada S, Demuth T, Tran NL, Hoelzinger DB, Berens ME. Molecular targets of glioma invasion. Cell Mol Life Sci. 2007;64:458–478. - PMC - PubMed

Publication types