. 2011 Nov;52(11):2084-94.
doi: 10.1194/jlr.D018184. Epub 2011 Aug 23.

Fluorescence image screening for chemical compounds modifying cholesterol metabolism and distribution

Affiliations

Fluorescence image screening for chemical compounds modifying cholesterol metabolism and distribution

Reiko Ishitsuka et al. J Lipid Res. 2011 Nov.

Abstract

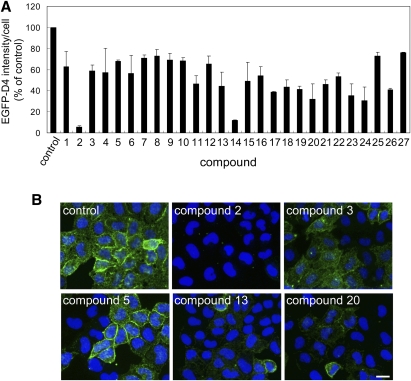
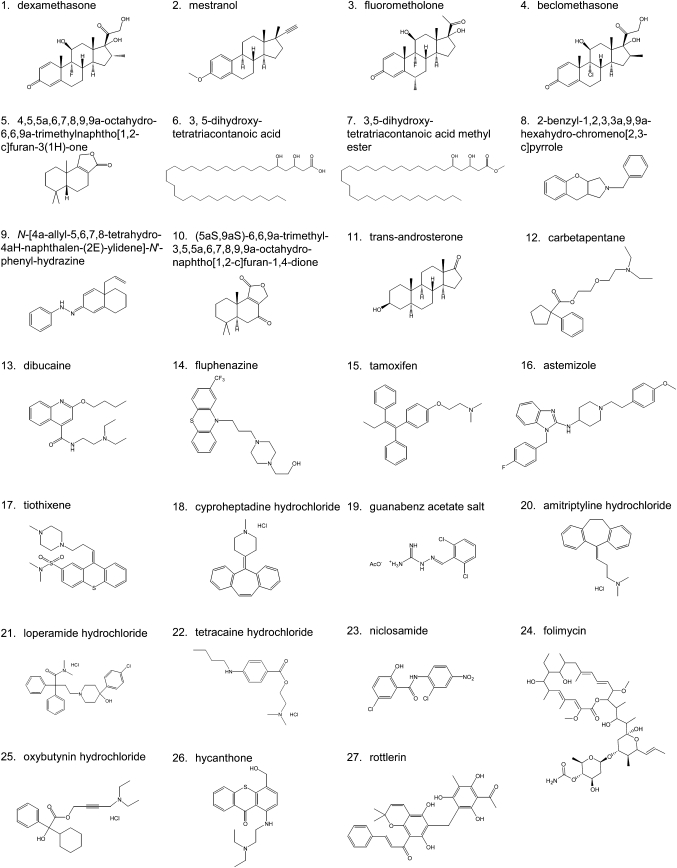
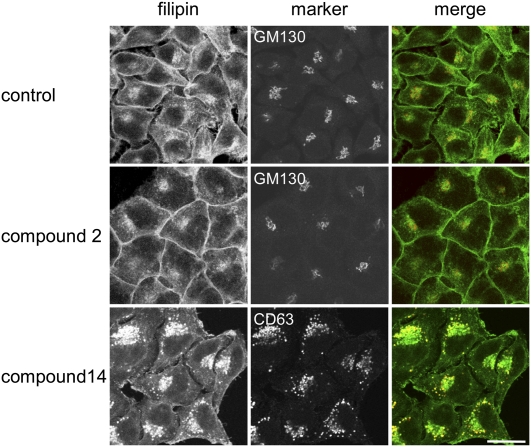
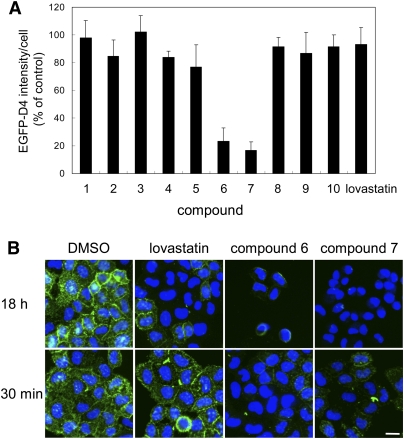
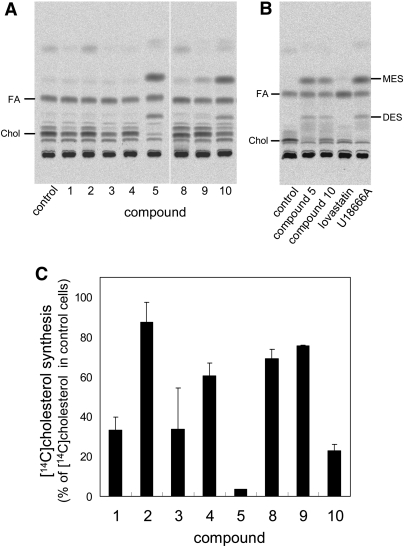
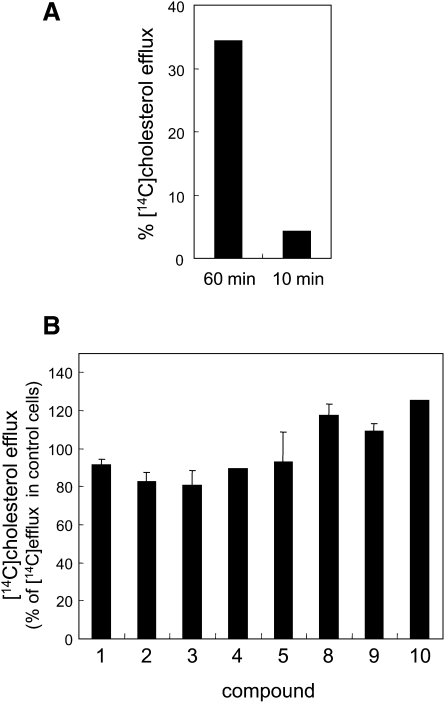
An automated fluorescence microscopy assay using a nontoxic cholesterol binding protein, toxin domain 4, (D4), was developed in order to identify chemical compounds modifying intracellular cholesterol metabolism and distribution. Using this method, we screened a library of 1,056 compounds and identified 35 compounds that decreased D4 binding to the cell surface. Among them, 8 compounds were already reported to alter the biosynthesis or the intracellular distribution of cholesterol. The remaining 27 hit compounds were further analyzed biochemically and histochemically. Cell staining with another fluorescent cholesterol probe, filipin, revealed that 17 compounds accumulated cholesterol in the late endosomes. Five compounds decreased cholesterol biosynthesis, and two compounds inhibited the binding of D4 to the membrane. This visual screening method, based on the cholesterol-specific probe D4 in combination with biochemical analyses, is a cell-based, sensitive technique for identifying new chemical compounds and modifying cholesterol distribution and metabolism. Furthermore, it is suitable for high-throughput analysis for drug discovery.


Figures

Fig.1.
Fig.1.
Binding of EGFP-D4 and filipin to cholesterol-containing liposomes. A: EGFP-D4 was incubated with PC/cholesterol or SM/cholesterol liposomes (MLVs) for 30 min at room temperature. After centrifugation, the pellet fractions were subjected to SDS-PAGE followed by CBB staining. B: EGFP-D4 bound to PC/cholesterol (filled bar) and SM/cholesterol liposomes (open bar) was stained with SYPRO Ruby, and quantitated as described under MATERIALS AND METHODS. Data are the mean ± average deviation of two independent experiments. C: Filipin (10 μM) was incubated with 100 μM liposomes (SUVs) for 30 min at room temperature. Absorbance at 320 nm (Peak 3) and 356 nm (Peak 1) was determined as described under MATERIALS AND METHODS. Data represent the mean ± SD (n = 3).
Fig. 2.
Fig. 2.
EGFP-D4 and filipin labeling of HeLa cells treated with lovastatin and U18666A. A: HeLa cells were treated with or without 8 μM lovastatin and 100 μM mevalonate, or 2 μg/ml U18666A in FBS- or LPDS-containing medium for 18 h. Cells were labeled with EGFP-D4 and Hoechst 33342 as described in MATERIALS AND METHODS. Images were acquired using In Cell Analyzer 1000 with a 20× objective. Bar = 20 μm. B: Fluorescence intensity of EGFP-D4 bound to cells was normalized by cell number as described in MATERIALS AND METHODS. Data represent the mean ± SD (n = 4). C: HeLa cells were treated with 8 μM lovastatin and 100 μM mevalonate, or 2 μg/ml U18666A in LPDS-containing medium for 18 h. The cells were labeled with filipin as described in MATERIALS AND METHODS. Images were acquired using In Cell Analyzer 1000 with a 20× objective. Bar = 20 μm.
Fig. 3.
Fig. 3.
EGFP-D4 labeling of CHO cells treated with lovastatin and U18666A. A: CHO cells were treated with or without 8 μM lovastatin and 100 μM mevalonate, or 2 μg/ml U18666A in FBS- or LPDS-containing medium for 18 h. Cells were labeled with EGFP-D4 and Hoechst 33342 as described in MATERIALS AND METHODS. Images were acquired using In Cell Analyzer 1000 with a 20× objective. Bar = 20 μm. B: Fluorescence intensity of EGFP-D4 bound to cells was normalized by cell number as described in MATERIALS AND METHODS. Data are the mean ± average deviation of two independent experiments.
Fig. 4.
Fig. 4.
EGFP-D4-labeling of HeLa cells treated with the compounds that are reported to inhibit cholesterol biosynthesis and intracellular cholesterol distribution. HeLa cells were treated without or with 0.5 μg/ml lovastatin, 0.5 μg/ml simvastatin, 0.5 μg/ml compactin, 0.5 μg/ml fluvastatin, 5 μg/ml desipramine, 5 μg/ml imipramine, or 50 μg/ml dimethyl-β-cyclodextrin in LPDS-containing medium for 18 h. Cells were labeled with EGFP-D4 and Hoechst 33342 as described in MATERIALS AND METHODS. Images were acquired using In Cell Analyzer 1000 with a 20× objective. Bar = 20 μm.
Fig. 5.
Fig. 5.
EGFP-D4 labeling of cells treated with the hit compounds. HeLa cells were treated without or with 5 μg/ml compounds in medium with 10% LPDS for 18 h. Cells were labeled with EGFP-D4 and Hoechst 33342 as described in MATERIALS AND METHODS. A: Fluorescence intensity of EGFP-D4 per cell is shown as a percentage of control. Data are the mean ± average deviation of two independent experiments (compounds 2, 5, 7–11, 14–17, 19, 21, 22, and 25–27) or mean ± SD of three independent experiments (compounds 1, 3, 4, 6, 12, 13, 18, 20, 23, and 24). B: Images of EGFP-D4-labeled cells after treatment with hit compounds (compounds 2, 3, 5, 13, and 20). Images were acquired using In Cell Analyzer 1000 with a 20× objective. Bar = 20 μm.
Fig. 6.
Fig. 6.
Chemical structure of compounds that decreased EGFP-D4 labeling in the plasma membrane.
Fig. 7.
Fig. 7.
Filipin labeling of cells treated with hit compounds. HeLa cells were treated without or with 12.5 μg/ml hit compounds in 10% LPDS-containing medium for 18 h. The cells were labeled with filipin and anti GM130 antibodies or anti CD63 antibodies, as described in MATERIALS AND METHODS. Images were obtained under a Zeiss LSM510 confocal microscope with 63× objective. Bar = 20 μm.
Fig. 8.
Fig. 8.
Effects of incubation time with the hit compounds on EGFP-D4 labeling of cells. A: HeLa cells were treated with 12.5 μg/ml hit compounds or 8 μM lovastatin in LPDS-containing medium for 30 min. Cells were labeled with EGFP-D4 and Hoechst 33342, and fluorescence intensity of EGFP-D4 bound to cell surface was normalized by cell number as described in MATERIALS AND METHODS. Data represent the mean ± SD (n = 4). B: HeLa cells were treated with DMSO, 8 μM lovastatin, 12.5 μg/ml compound 6, or compound 7 in 10% LPDS-containing medium for 18 h or 30 min. Cells were labeled with EGFP-D4 and Hoechst 33342. Images were acquired using In Cell Analyzer 1000 with a 20× objective. Bar = 20 μm.
Fig. 9.
Fig. 9.
Effects of the hit compounds on de novo cholesterol biosynthesis. HeLa cells were cultured in the medium with LPDS for 18 h. Cells were then labeled with [14C]acetic acid for 2 h in the presence of 12.5 μg/ml compounds, 8 μM lovastatin or 2 μg/ml U18666A. Lipids were extracted and separated on HPTLC (A, B). The positions of 2,3-monoepoxysqualene (MES) and 2,3;22,23-diepoxysqualene (DES) were determined using nonradioactive standards (B). The incorporation of radioactivity into the band corresponding to cholesterol was measured as described in MATERIALS AND METHODS. Data are expressed as a percentage of control (C). Data are the mean ± average deviation of two independent experiments (compounds 5 and 8–10) or mean ± SD of three independent experiments (compounds 1–4).
Fig. 10.
Fig. 10.
Effects of hit compounds on cholesterol transport. HeLa cells were cultured in medium with LPDS for 18 h. Cells were then labeled with [14C]acetic acid for 15 min in the presence of 12.5 μg/ml compounds, and chase was performed in the presence of 12.5 μg/ml compounds and 8 μM lovastatin for 1 h. In A, chase was also performed for 10 min. During the last 10 min of the chase, cells were incubated with 10 mM methyl-β-cyclodextrin. From medium and cells, lipids were extracted and separated on HPTLC. The arrival of cholesterol on the plasma membrane was determined as described in MATERIALS AND METHODS. Data are expressed as a percentage of control (B). Data are the mean ± average deviation of two independent experiments (compounds 1, 3, and 8–10) or mean ± SD of three independent experiments (compounds 2, 4, and 5).

Similar articles

Cited by

References

    1. Simons K., Vaz W. L. 2004. Model systems, lipid rafts, and cell membranes. Annu. Rev. Biophys. Biomol. Struct. 33: 269–295 - PubMed
    1. Epand R. M., Thomas A., Brasseur R., Epand R. F. 2010. Cholesterol interaction with proteins that partition into membrane domains: an overview. Subcell. Biochem. 51: 253–278 - PubMed
    1. Simons K., Toomre D. 2000. Lipid rafts and signal transduction. Nat. Rev. Mol. Cell Biol. 1: 31–39 - PubMed
    1. Goldstein J. L., DeBose-Boyd R. A., Brown M. S. 2006. Protein sensors for membrane sterols. Cell. 124: 35–46 - PubMed
    1. Ikonen E. 2008. Cellular cholesterol trafficking and compartmentalization. Nat. Rev. Mol. Cell Biol. 9: 125–138 - PubMed

Publication types

MeSH terms