. 2011 Aug;23(8):2864-79.
doi: 10.1105/tpc.111.086637. Epub 2011 Aug 23.

Generation of signaling specificity in Arabidopsis by spatially restricted buffering of ligand-receptor interactions

Affiliations

Generation of signaling specificity in Arabidopsis by spatially restricted buffering of ligand-receptor interactions

Emily B Abrash et al. Plant Cell. 2011 Aug.

Abstract

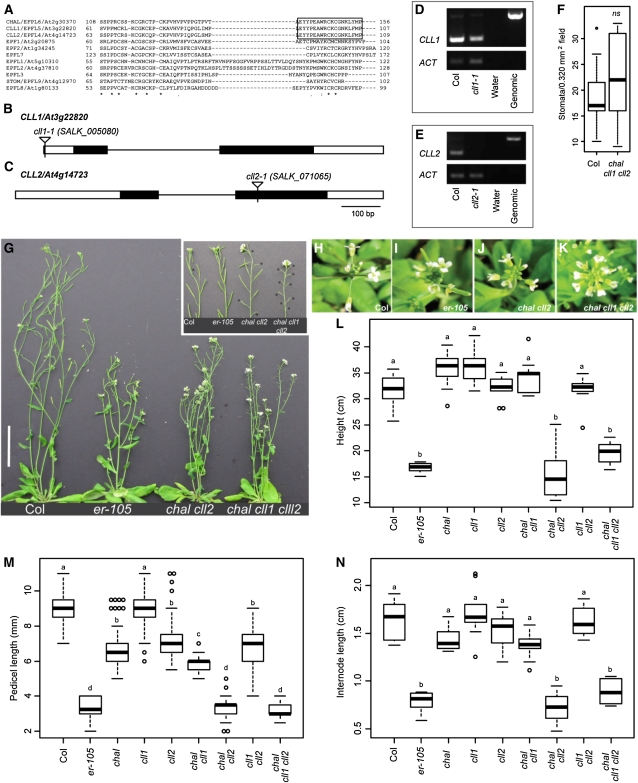
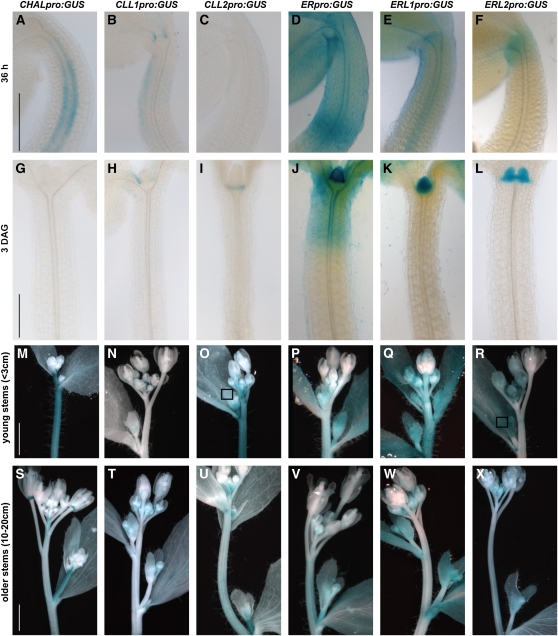
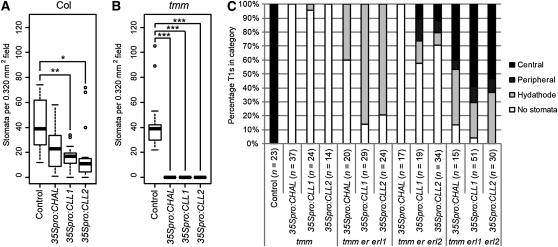
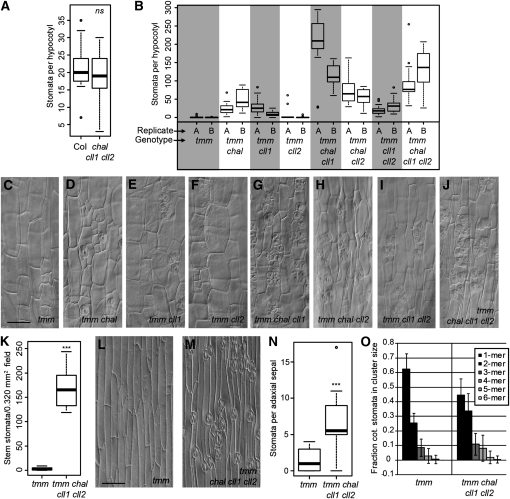
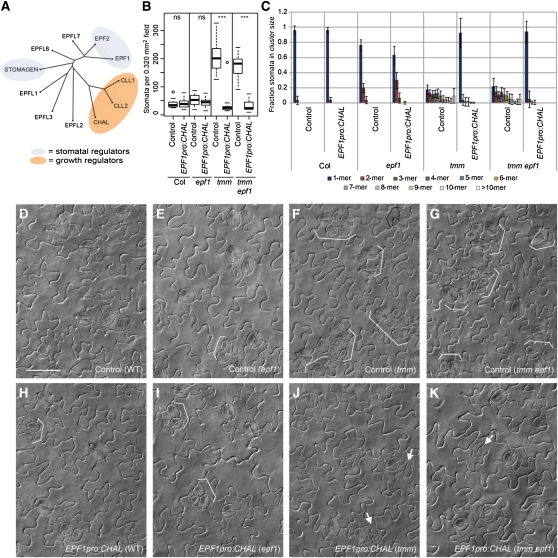
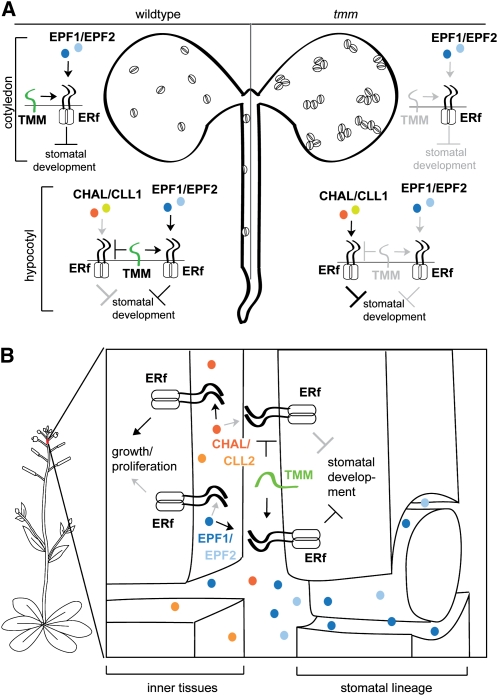
Core signaling pathways function in multiple programs during multicellular development. The mechanisms that compartmentalize pathway function or confer process specificity, however, remain largely unknown. In Arabidopsis thaliana, ERECTA (ER) family receptors have major roles in many growth and cell fate decisions. The ER family acts with receptor TOO MANY MOUTHS (TMM) and several ligands of the EPIDERMAL PATTERNING FACTOR LIKE (EPFL) family, which play distinct yet overlapping roles in patterning of epidermal stomata. Here, our examination of EPFL genes EPFL6/CHALLAH (CHAL), EPFL5/CHALLAH-LIKE1, and EPFL4/CHALLAH-LIKE2 (CLL2) reveals that this family may mediate additional ER-dependent processes. chal cll2 mutants display growth phenotypes characteristic of er mutants, and genetic interactions are consistent with CHAL family molecules acting as ER family ligands. We propose that different classes of EPFL genes regulate different aspects of ER family function and introduce a TMM-based discriminatory mechanism that permits simultaneous, yet compartmentalized and distinct, function of the ER family receptors in growth and epidermal patterning.


Figures

Figure 1.
Figure 1.
Mutations in CHAL and Paralogs CLL1 and CLL2 Generate Nonstomatal Growth Phenotypes Resembling er Mutants. (A) ClustalW2 (Chenna et al., 2003) alignment of C-terminal region of EPF-like proteins. The box indicates the region highly conserved between CHAL, CLL1, and CLL2; asterisk, identical residue; colon, conserved substitution; dot, semiconserved substitution. Numbers immediately preceding and following the sequence indicate the amino acid position within each respective protein. (B) and (C) Schematics of CLL1 and CLL2 loci, respectively. Empty boxes, annotated untranslated regions; filled boxes, exons; lines, introns; triangles, positions of T-DNA insertions. (D) and (E) RT-PCR analysis of cll1-1 and cll2-1 alleles, respectively (ACT is ACTIN control; “Genomic” indicates genomic DNA template). (F) Quantification of stomatal density in 8 DAG adaxial cotyledons. Data are displayed as boxplot graphs following standard conventions. Bold lines indicate medians, boxes indicate quartiles above and below median, whiskers extend to most extreme value no more than 1.5 interquartile ranges from box, and circles indicate values beyond whiskers. n ≥ 14 plants per genotype. ns, not significantly different from the wild type by Wilcoxon two-sample test (P > 0.2). (G) Aerial portions of 48 DAG Col, er-105, chal cll2, and chal cll1 cll2 plants. Inset of primary inflorescences shows sterility of chal cll1 cll2, and asterisks mark sterile siliques. Bar = 5 cm. (H) to (K) Inflorescence stem apices ~1 week after bolting illustrating reduction in pedicel elongation in er-105 (I), chal cll2 (J), and chal cll1 cll2 (K) relative to Col (H). (L) Quantification of plant height at 48 DAG; n = 10 plants per genotype. (M) Quantification of pedicel lengths at 6.5 weeks of age; n = 50 pedicels per genotype, as five pedicels sampled from each of 10 individuals. (N) Quantification of internode lengths at 6.5 weeks of age; n = 10 individuals per genotype. Values represent average internode length calculated over four adjacent internodes. In (L) to (N), letters a to d indicate maximal nonsignificant sets (MNS) to which the genotype belongs. Genotypes found in the same MNS are not significantly different from one another, whereas genotypes not found in a common MNS are significantly different from one another, at the specified significance level (α = 0.01 by nonparametric multiple comparisons by STP). [See online article for color version of this figure.]
Figure 2.
Figure 2.
Transcriptional Reporters for CHALf and ERf Are Coexpressed in Tissues Consistent with Their Loss-of-Function Phenotypes. All images are of reporters based on promoters of indicated genes fused to GUS (Pro:GUS) and are incubated for times described in Methods. (A) to (F) Pro:GUS expression at 36 h after germination; seedlings are oriented to provide view of hypocotyl, cotyledon bases, and tips of first leaves and to capture the strongest expression levels. Specific reporters are indicated above each image, and each column represents the same reporter construct. (G) to (L) Pro:GUS expression at 3 DAG. (M) to (R) Pro:GUS expression of primary inflorescence soon after bolting (plant height < 3 cm). Boxes mark nonstaining leaf in CLL2 (O) and staining leaf in ERL2 (R). (S) to (X) Pro:GUS expression in older primary inflorescence (plant height 10 to 20 cm). Bars = 200 μm in (A) and (G) and 2 mm in (M) and (S). All images in a row are at the same magnification.
Figure 3.
Figure 3.
The Dependence of CHALf Overexpression Phenotypes on Receptor Genotypes Is Revealed through Stomatal Phenotype Assays. (A) to (B) Quantification of effects of CHALf overexpression on stomatal density in wild-type and tmm adaxial cotyledons, respectively (10 DAG T1s). Control = transformation with empty vector. Bold lines indicate medians, boxes indicate quartiles above and below median, and whiskers extend to most extreme value no more than 1.5 interquartile ranges from box. n = 15 T1s per genotype in (A); n = 14 T1s per genotype in (B). *, significant at α = 0.05; **, significant at α = 0.01; ***, significant at α = 0.001 by nonparametric multiple comparisons by STP. (C) Phenotypes of CHALf-overexpressing T1s in tmm and ERf mutant backgrounds (10 DAG). Each T1 was scored for rescue of stomatal differentiation (for details, see Methods). From least to most rescued, categories were defined as the following: no stomata = no stomata in cotyledons; hydathode = one or more stomata in hydathode region of cotyledon; peripheral = one or more stomata in cotyledon periphery; central = one or more stomata in central cotyledon. The plants scored quantitatively in (B) are a subset of those scored qualitatively in (C).
Figure 4.
Figure 4.
The Dependence of CHALf Loss-of-Function Phenotypes on TMM Is Revealed through Stomatal Phenotype Assays. (A) Quantification of hypocotyl stomata in Col and chal cll1 cll2 (12 DAG, n = 20 plants per genotype). Bold lines indicate medians, boxes indicate quartiles above and below median, and whiskers extend to most extreme value no more than 1.5 interquartile ranges from box. ns, not significantly different from the wild type by Welch two-sample t test (P > 0.2). (B) Quantification of hypocotyl stomata in CHALf mutants combined with tmm (12 DAG, n ≥ 10 plants per genotype). Each shaded or unshaded block denotes a genotype, while letters denote replicates. Plants were grown in two replicate batches A and B, each of which included all eight genotypes. (C) to (J) DIC images of 12 DAG hypocotyls with genotypes indicated in each panel. (K) Quantification of inflorescence stem stomatal density (n ≥ 9 plants per genotype). ***, P < 0.001 by Welch two-sample t test. (L) and (M) DIC images of inflorescence stems with genotypes indicated in each panel. (N) Quantification of stomata in adaxial sepals (n ≥ 10 sepals per genotype). ***P < 0.001 by Wilcoxon two-sample test. (O) Extent of stomatal clustering in adaxial cotyledons (8 DAG, n ≥ 20 plants per genotype). Clusters are categorized by the number of stomata (“mers”) they contain; unclustered stomata are 1-mers. Shaded bars indicate mean; error bars are ± sd. Bars = 50 μm in (C) and (L); (C) to (J) are at the same scale, and (L) and (M) are at the same scale.
Figure 5.
Figure 5.
CHAL Can Enforce One-Cell Spacing When Expressed under the EPF1 Promoter in a tmm Background. (A) Neighbor-joining tree depicting relationships between EPFL family proteins (modified from Rowe and Bergmann, 2010). Shading indicates proteins of known function. (B) Quantification of the effects of EPF1pro:CHAL on stomatal density (versus empty vector) in 10 DAG abaxial cotyledons. Bold lines indicate medians, boxes indicate quartiles above and below median, and whiskers extend to most extreme value no more than 1.5 interquartile ranges from box. n = 15 T1s for each line. ns, not significant (P > 0.30 by Wilcoxon two-sample test); ***, P < 0.001 by Wilcoxon two-sample test. (C) Quantification of the effects of EPF1pro:CHAL on stomatal clustering (versus empty vector) in 10 DAG abaxial cotyledons. Shaded bars indicate mean; error bars are ± sd. (D) to (K) Representative DIC images of EPF1pro:CHAL and empty vector T1s. Genotypes and transgenes are indicated on each panel. White brackets indicate clustered stomata; white arrows indicate apparent transdifferentiated cells observed in strongly rescued lines. Bar = 50 μm in (D); (D) to (K) are at the same scale. [See online article for color version of this figure.]
Figure 6.
Figure 6.
Models in Which CHALf Acting through ERf Receptors in a Pathway Inhibited by TMM Can Explain Observed Phenotypes. (A) Model for CHALf and EPF1/2 interactions with TMM and ERf receptors in different regions of wild-type and tmm seedlings. Arrows represent positive influences on signaling or developmental processes; T-bars represent negative influences. Grayed-out elements are inactive or not present in a particular organ or genotype. The positive regulator of stomatal development EPFL9/STOMAGEN also requires TMM for activity, but for simplicity, is not shown here. The left half of the seedling depicts the wild type (TMM+). In both the cotyledon and hypocotyl, stomatal lineage ligands EPF1/2 signal through ERf and TMM receptors to inhibit stomatal development for proper patterning. CHALf ligands in the hypocotyl do not influence stomatal patterning due to the presence of TMM, which dampens CHALf signaling. The right half of the seedling depicts the tmm mutant: Without TMM, EPF1/2 do not inhibit stomatal development, leading to the formation of stomatal clusters in cotyledons. The opposite effect is observed in the tmm hypocotyl, however, due to the presence of CHALf ligands in this organ. Without TMM’s dampening effect, CHALf ligands overactivate ERf receptors, resulting in a strong inhibition of stomatal development. (B) Model for TMM compartmentalization of ERf receptor functions in growth and stomatal development in stems. Apoplast-mobile CHALf and EPF1/2 ligands can encounter ERf receptors both in the stomatal lineage and in nonstomatal cells, such as the inner tissues. TMM, which is present only in the stomatal lineage, differentially regulates these two ligand classes. Thus, CHALf signaling does not affect stomatal development because it is dampened by TMM, while EPF1/2 signaling does not affect growth because it is potentiated by TMM. Arrows represent positive influences on signaling pathways or developmental processes; T-bars represent negative influences. Grayed-out elements represent inactive pathways.

Similar articles

Cited by

References

    1. Abrash E.B., Bergmann D.C. (2010). Regional specification of stomatal production by the putative ligand CHALLAH. Development 137: 447–455 - PubMed
    1. Alonso J.M., et al. (2003). Genome-wide insertional mutagenesis of Arabidopsis thaliana. Science 301: 653–657 - PubMed
    1. Bergmann D.C., Sack F.D. (2007). Stomatal development. Annu. Rev. Plant Biol. 58: 163–181 - PubMed
    1. Bhave N.S., Veley K.M., Nadeau J.A., Lucas J.R., Bhave S.L., Sack F.D. (2009). TOO MANY MOUTHS promotes cell fate progression in stomatal development of Arabidopsis stems. Planta 229: 357–367 - PubMed
    1. Butenko M.A., Vie A.K., Brembu T., Aalen R.B., Bones A.M. (2009). Plant peptides in signalling: Looking for new partners. Trends Plant Sci. 14: 255–263 - PubMed

Publication types

MeSH terms