

Hyperglucagonemia precedes a decline in insulin secretion and causes hyperglycemia in chronically glucose-infused rats
- PMID: 21862723
- PMCID: PMC3233775
- DOI: 10.1152/ajpendo.00175.2011
Hyperglucagonemia precedes a decline in insulin secretion and causes hyperglycemia in chronically glucose-infused rats
Abstract
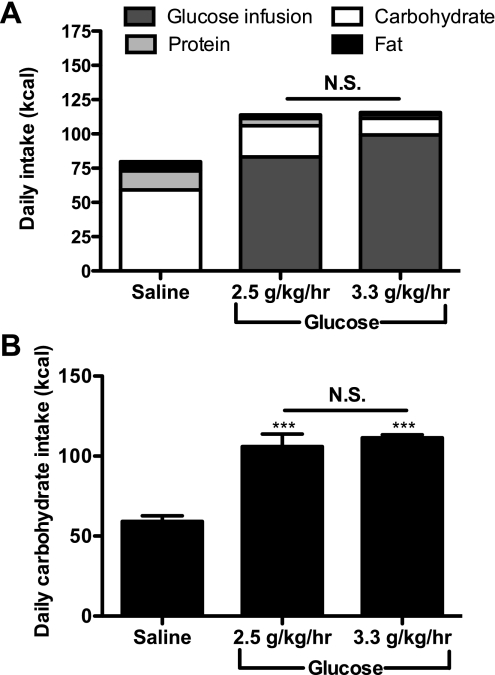
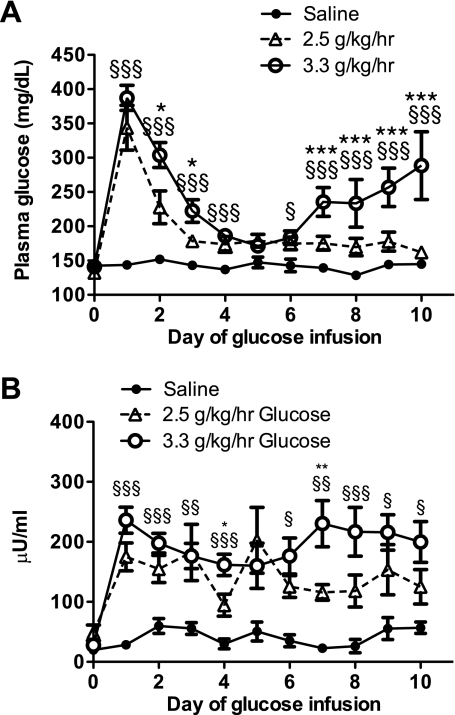
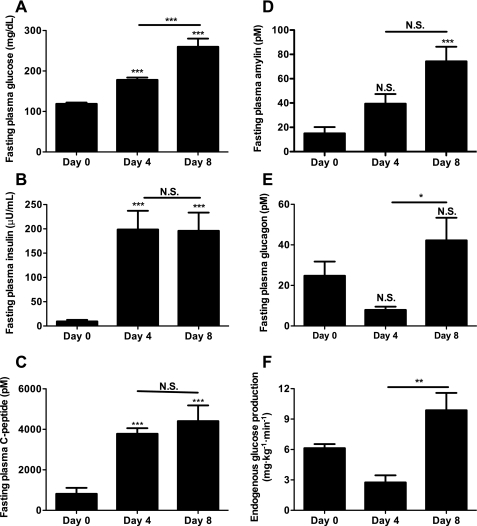
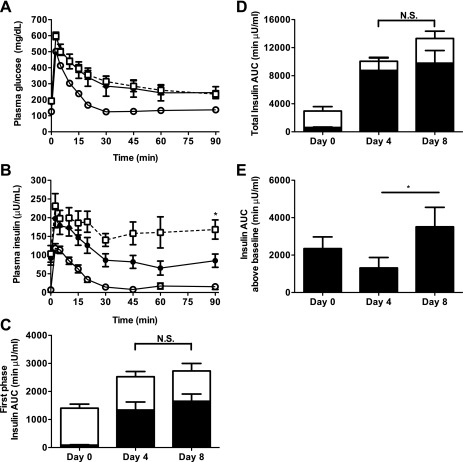
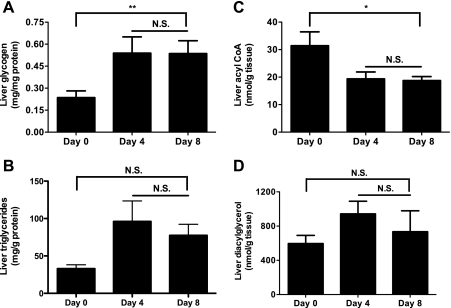
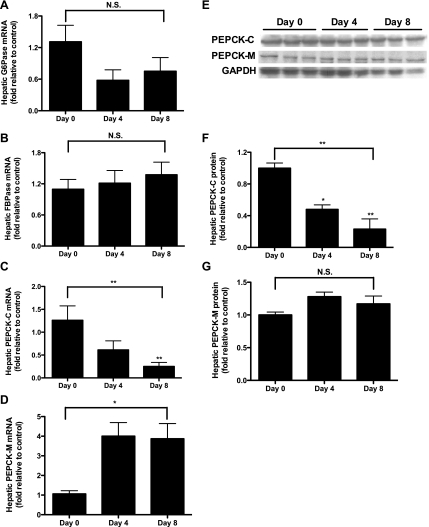
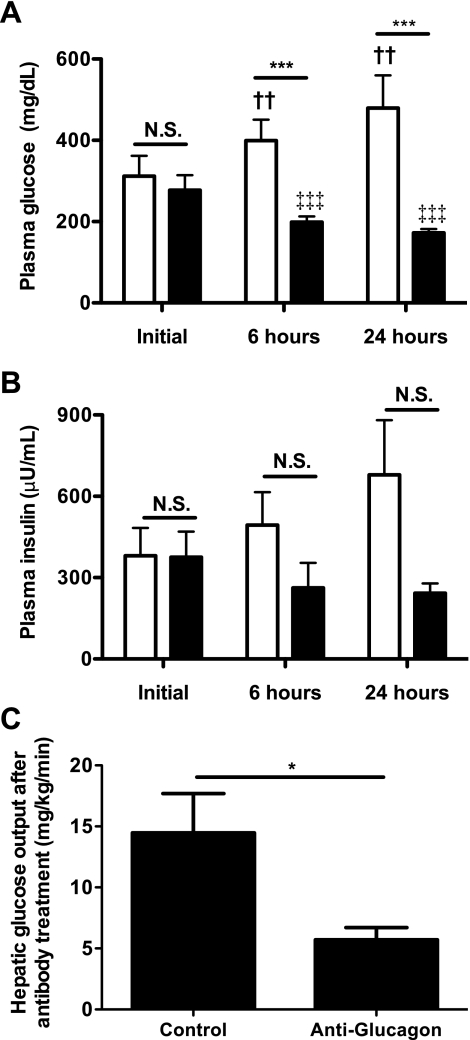
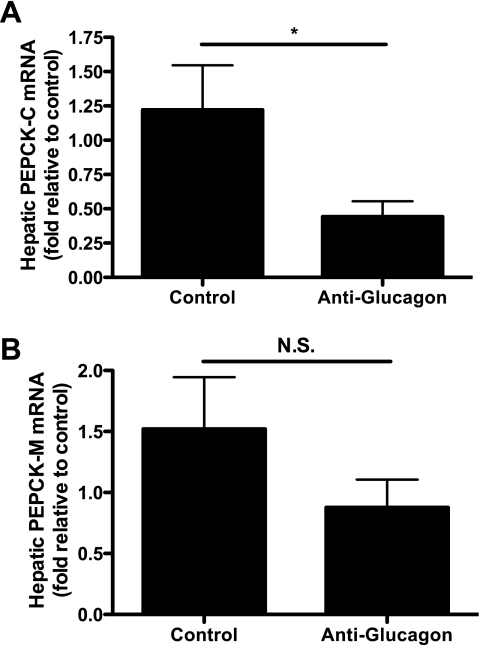
Islet damage from glucose toxicity is implicated in the pathogenesis of type 2 diabetes, but the sequence of events leading to islet cell dysfunction and hyperglycemia remains unclear. To examine the early stages of islet pathology resulting from increased basal glucose loads, normal awake rats were infused with glucose continuously for 10 days. Plasma glucose and markers of islet and liver function were monitored throughout the infusion. After initial hyperglycemia, rats adapted to the infusion and maintained euglycemia for approximately 4 days. Continued infusion led to worsening hyperglycemia in just 5% of rats after 6 days, but 69% after 8 days and 89% after 10 days, despite unchanged basal and stimulated plasma insulin and C-peptide concentrations. In contrast, plasma glucagon concentrations increased fivefold. Endogenous glucose production (EGP) was appropriately suppressed after 4 days (2.8 ± 0.7 vs. 6.1 ± 0.4 mg·kg(-1)·min(-1) on day 0, P < 0.001) but tripled between days 4 and 8 (9.9 ± 1.7 mg·kg(-1)·min(-1), P < 0.01). Surprisingly, the increase in EGP was accompanied by increased mitochondrial phosphoenolpyruvate carboxykinase expression with appropriate suppression of the cytosolic isoform. Infusion of anti-glucagon antibodies normalized plasma glucose to levels identical to those on day 4 and ∼300 mg/dl lower than controls. This improved glycemia was associated with a 60% reduction in EGP. These data support the novel concept that glucose toxicity may first manifest as α-cell dysfunction prior to any measurable deficit in insulin secretion. Such hyperglucagonemia could lead to excessive glucose production overwhelming the capacity of the β-cell to maintain glucose homeostasis.
Figures
Similar articles
-
The impact of glucagon to support postabsorptive glucose flux and glycemia in healthy rats and its attenuation in male Zucker diabetic fatty rats.Am J Physiol Endocrinol Metab. 2024 Mar 1;326(3):E308-E325. doi: 10.1152/ajpendo.00192.2023. Epub 2024 Jan 24. Am J Physiol Endocrinol Metab. 2024. PMID: 38265288 Free PMC article.
-
Type 2 diabetic patients have increased gluconeogenic efficiency to substrate availability, but intact autoregulation of endogenous glucose production.Scand J Clin Lab Invest. 2005;65(4):307-20. doi: 10.1080/00365510510025692. Scand J Clin Lab Invest. 2005. PMID: 16076686 Clinical Trial.
-
Mild Physiologic Hyperglycemia Induces Hepatic Insulin Resistance in Healthy Normal Glucose-Tolerant Participants.J Clin Endocrinol Metab. 2019 Jul 1;104(7):2842-2850. doi: 10.1210/jc.2018-02304. J Clin Endocrinol Metab. 2019. PMID: 30789980 Free PMC article.
-
On the role of the gut in diabetic hyperglucagonaemia.Dan Med J. 2017 Apr;64(4):B5340. Dan Med J. 2017. PMID: 28385175 Review.
-
Inhibition of glucagon secretion.Adv Pharmacol. 2005;52:151-71. doi: 10.1016/S1054-3589(05)52008-8. Adv Pharmacol. 2005. PMID: 16492545 Review.
Cited by
-
Dapagliflozin stimulates glucagon secretion at high glucose: experiments and mathematical simulations of human A-cells.Sci Rep. 2016 Aug 18;6:31214. doi: 10.1038/srep31214. Sci Rep. 2016. PMID: 27535321 Free PMC article.
-
Glucagon regulates hepatic kisspeptin to impair insulin secretion.Cell Metab. 2014 Apr 1;19(4):667-81. doi: 10.1016/j.cmet.2014.03.005. Cell Metab. 2014. PMID: 24703698 Free PMC article.
-
Genomics of Islet (Dys)function and Type 2 Diabetes.Trends Genet. 2017 Apr;33(4):244-255. doi: 10.1016/j.tig.2017.01.010. Epub 2017 Feb 27. Trends Genet. 2017. PMID: 28245910 Free PMC article. Review.
-
Gs-DREADD Knock-In Mice for Tissue-Specific, Temporal Stimulation of Cyclic AMP Signaling.Mol Cell Biol. 2017 Apr 14;37(9):e00584-16. doi: 10.1128/MCB.00584-16. Print 2017 May 1. Mol Cell Biol. 2017. PMID: 28167604 Free PMC article.
-
Current insights and new perspectives on the roles of hyperglucagonemia in non-insulin-dependent type 2 diabetes.Curr Hypertens Rep. 2013 Oct;15(5):522-30. doi: 10.1007/s11906-013-0383-y. Curr Hypertens Rep. 2013. PMID: 23996678 Free PMC article. Review.
References
-
- No authors listed Report of the Expert Committee on the Diagnosis and Classification of Diabetes Mellitus. Diabetes Care 120: 1183–1197, 1997 - PubMed
-
- Aguilar-Parada E, Eisentraut AM, Unger RH. Pancreatic glucagon secretion in normal and diabetic subjects. Amer J Med Sci 257: 415–419, 1969 - PubMed
-
- Bier DM, Arnold KJ, Sherman WR, Holland WH, Holmes WF, Kipnis DM. In vivo measurement of glucose and alanine metabolism with stable isotopic tracers. Diabetes 26: 1005–1015, 1977 - PubMed
Publication types
MeSH terms
Substances
Grants and funding
LinkOut - more resources
Full Text Sources
Other Literature Sources
Medical
Miscellaneous