. 2011 Sep 21;23(37):374103.
doi: 10.1088/0953-8984/23/37/374103. Epub 2011 Aug 23.

Model of myosin node aggregation into a contractile ring: the effect of local alignment

Affiliations

Model of myosin node aggregation into a contractile ring: the effect of local alignment

Nikola Ojkic et al. J Phys Condens Matter. .

Abstract

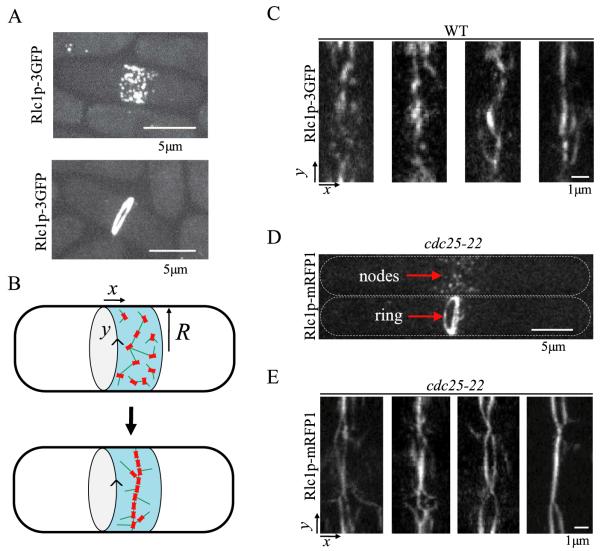
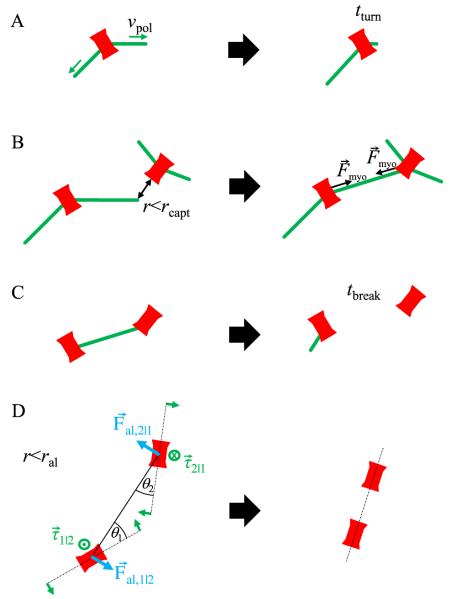
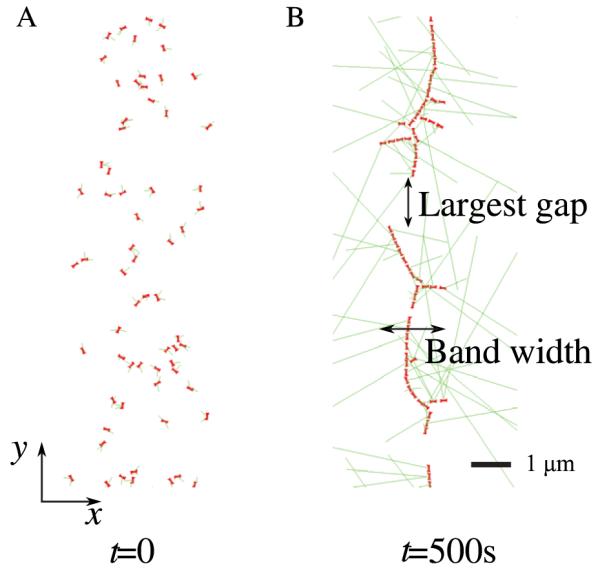
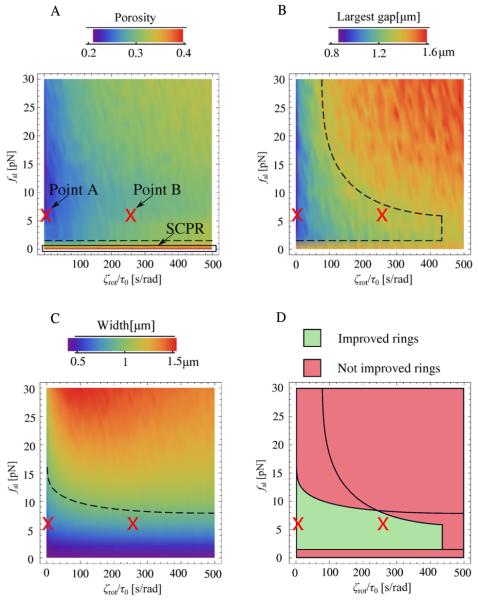
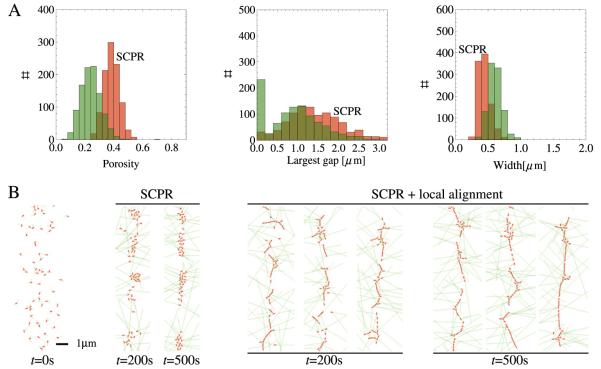
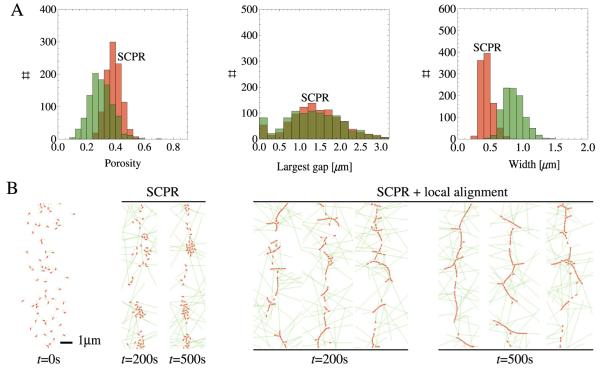
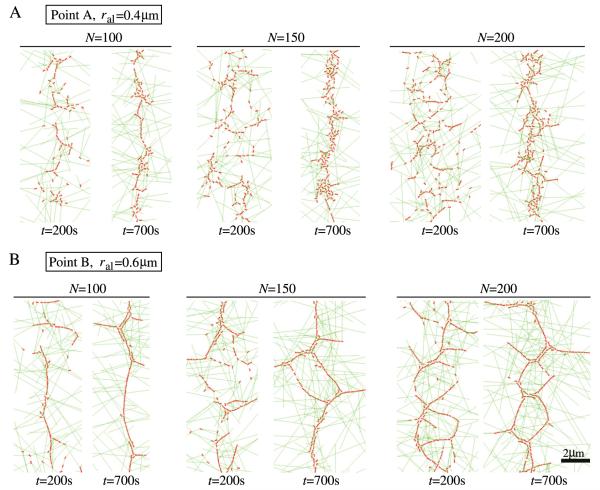
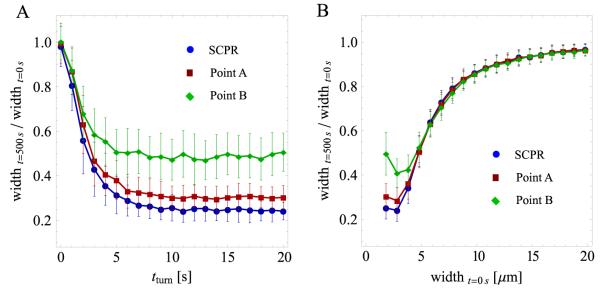
Actomyosin bundles frequently form through aggregation of membrane-bound myosin clusters. One such example is the formation of the contractile ring in fission yeast from a broad band of cortical nodes. Nodes are macromolecular complexes containing several dozens of myosin-II molecules and a few formin dimers. The condensation of a broad band of nodes into the contractile ring has been previously described by a search, capture, pull and release (SCPR) model. In SCPR, a random search process mediated by actin filaments nucleated by formins leads to transient actomyosin connections among nodes that pull one another into a ring. The SCPR model reproduces the transport of nodes over long distances and predicts observed clump-formation instabilities in mutants. However, the model does not generate transient linear elements and meshwork structures as observed in some wild-type and mutant cells during ring assembly. As a minimal model of node alignment, we added short-range aligning forces to the SCPR model representing currently unresolved mechanisms that may involve structural components, cross-linking and bundling proteins. We studied the effect of the local node alignment mechanism on ring formation numerically. We varied the new parameters and found viable rings for a realistic range of values. Morphologically, transient structures that form during ring assembly resemble those observed in experiments with wild-type and cdc25-22 cells. Our work supports a hierarchical process of ring self-organization involving components drawn together from distant parts of the cell followed by progressive stabilization.


Figures

Figure 1
Figure 1
Images of fission yeast cells in the process of contractile ring formation from a condensing band of cortical nodes. Transient linear elements form during the condensation process. (A) Dividing wild-type cells expressing myosin light chain Rlc1-3GFP, z-projections of confocal microscopy slices [14]. Top: a cell at early stages of the condensation process shows nodes distributed in a broad band. The nodes are macromolecular complexes bound to the inner part of the cell membrane. Bottom: a cell with a contractile ring at the end of node condensation (a process that lasts ≈10 min). The ring subsequently constricts. (B) Cartoon of ring formation with the x-axis parallel to the long axis of the cell; y measures arc length along the cell circumference. In the SCPR model, nodes condense into rings through connections established by actin filaments (green). (C) Images showing examples of wild-type cells expressing Rlc1p-3GFP during the process of ring formation. Transient linear structures are seen, in addition to isolated nodes. The images are ‘radial projections’ obtained by projecting the intensity of a hollow tube aligned along the axis of the cell onto a surface of radius R = 1.73 μm representing the cell surface. In this projection the x and y directions are those illustrated in panel B. The projection was obtained using 26 z-slices, separated by 0.2 μm. (D) z-projections of cdc25-22 cells expressing Rlc1p-mRFP1 [14]. cdc25-22 cells grow longer and accumulate more nodes in a wider band compared to wild-type cells during arrest from entering mitosis. After release into mitosis, nodes condense to contractile rings [23]. Top: cell with nodes; bottom: cell with ring. (E) Radial projection of four representative cdc25-22 cells in the process of ring assembly (obtained by 24 z-slices separated by 0.3 μm). Long linear structures are more evident compared to wild-type cells. These linear elements extend along many directions, forming meshworks. Near the end of ring assembly, parallel bundles resembling ‘two rings’ appear. In some cells, those bundles that form a ring around the cell constrict independently of the other parts of the bundle structure.
Figure 2
Figure 2
The search, capture, pull, and release model with the addition of local node alignment. Nodes are drawn as bars to illustrate their assumed polarization. (A) Search: two actin filaments grow out of each node along randomly chosen directions with rate vpol. The average lifetime of actin filaments is tturn. Filaments start to grow along a new direction after breakage. (B) Capture and pull: when an actin filament tip approaches another node, a connection is established. Connected nodes move toward one another by pulling force Fmyo. (C) Release: the average lifetime of a connection is tbreak. After breakage, filaments start growing along a random direction as in panel A. (D) Local node alignment: nodes within ral of one another experience a torque τ that rotates them to point toward one another. Additionally, the force Fal acts on node centers, perpendicularly to the line that joins two nodes. We note that even though nodes are drawn as elongated objects, the shape of the nodes is not taken into account explicitly: for example, we did not consider anisotropic friction coefficients.
Figure 3
Figure 3
Snapshots of simulations showing the initial node distribution in (A) and nodes condensed into a ring structure in (B). The x-axis is parallel to the long axis of the cell; the y-axis is arc length along the cell circumference. Nodes are initially distributed according to a Gaussian distribution of standard deviation 0.9 μm along the x-axis and according to a uniform distribution along the y-axis [14]. Panel (B) shows largest gap and band width.
Figure 4
Figure 4
Results of Monte Carlo simulations of a model with local node alignment. (A)–(C) Average porosity, largest gap, and band width at 500 s, as a function of the parameter ζrot/τ0 (which measures the resistance to rotation of the polarization axis) and the aligning force fal. ζrot/τ0 was varied in steps of 10 s rad−1 and fal in steps of 2 pN. The results for each pair of parameter values are averages of 1000 simulations. The case fal = 0 pN reduces to the pure SCPR model (no local node alignment). Dashed lines indicate boundaries of regions of observable quantities consistent with the criteria for viable ring formation of the main text. (D) Plot showing the overlap of regions in parameter space with porosity, largest gap and band width that meet the criteria for viable ring formation of the main text.
Figure 5
Figure 5
Statistics and snapshots of simulations using parameters corresponding to point A in figure 4 (fal = 6 pN, ζrot/τ0 = 1 s rad−1). (A) Distributions of porosity, largest gap and band width for point A (green) and SCPR (red) at 500 s (1000 simulations). The peak at largest gap = 0 μm corresponds to rings that fully span the cell circumference. (B) Snapshots of rings at 200 s and 500 s for pure SCPR and SCPR with local node alignment. In the latter case, rings with no vertical gaps form frequently.
Figure 6
Figure 6
Same as figure 5 but for point B of figure 4 (fal = 6 pN, ζrot/τ0 = 250 s rad−1). Because of node resistance to rotation, side branches and gaps form during ring assembly.
Figure 7
Figure 7
Snapshots of simulations for cdc25-22 cells showing the formation of meshwork structures. (A) Snapshots of rings at different times using the same aligning parameters as point A of figure 4 (fal = 6 pN, ζrot/τ0 = 1 s rad−1) with ral = 0.4 μm. Cases with different numbers of nodes are shown (N = 100, 150, 200). (B) Snapshots of rings at different times with the same aligning parameters as for point B of figure 4 (fal = 6 pN, ζrot/τ0 = 250 s rad−1) with ral = 0.6 μm.
Figure 8
Figure 8
Results of simulations showing the ratio of band width at 500 s over initial band width versus unconnected filament turnover time tturn and initial band width. Each point is an average of 100 simulations; error bars represent one standard deviation. (A) Ratio of band width versus tturn for parameter values corresponding to pure SCPR, and SCPR with the alignment mechanism. Two sets of alignment parameters are shown, corresponding to points A and B in figure 4. All other parameters were fixed to the values described in the main text. Changes in tturn influence the average filament length of unconnected filaments, tturnvpol, where vpol = 0.2 μm s−1. For small values of tturn, the band of nodes fails to condense and small aggregates form. The behavior is similar for all three cases. Note that the case of ‘point B’ leads to wider bands compared to the other two cases (see figure 6). (B) Ratio of band width versus initial width, as in panel (A). The number of nodes was changed in proportion to the initial width such that the average density of nodes remained unchanged. Very wide bands fail to condense to rings and the behavior is similar for all three cases.

Similar articles

Cited by

References

    1. Liverpool TB, Marchetti MC. Phys. Rev. Lett. 2003;90:138102. - PubMed
    1. Cytrynbaum EN, Rodionov V, Mogilner A. J. Cell Sci. 2004;117:1381–97. - PubMed
    1. Kruse K, Joanny JF, Julicher F, Prost J, Sekimoto K. Phys. Rev. Lett. 2004;92:078101. - PubMed
    1. Kierfeld J, Khne T, Lipowsky R. Phys. Rev. Lett. 2005;95:038102. - PubMed
    1. Backouche F, Haviv L, Groswasser D, Bernheim-Groswasser A. Phys. Biol. 2006;3:264–73. - PubMed

Publication types

MeSH terms