. 2011 Sep;18(Pt 5):790-801.
doi: 10.1107/S0909049511023727. Epub 2011 Aug 5.

Microprobing the molecular spatial distribution and structural architecture of feed-type sorghum seed tissue (Sorghum Bicolor L.) using the synchrotron radiation infrared microspectroscopy technique

Affiliations

Microprobing the molecular spatial distribution and structural architecture of feed-type sorghum seed tissue (Sorghum Bicolor L.) using the synchrotron radiation infrared microspectroscopy technique

Peiqiang Yu. J Synchrotron Radiat. 2011 Sep.

Abstract

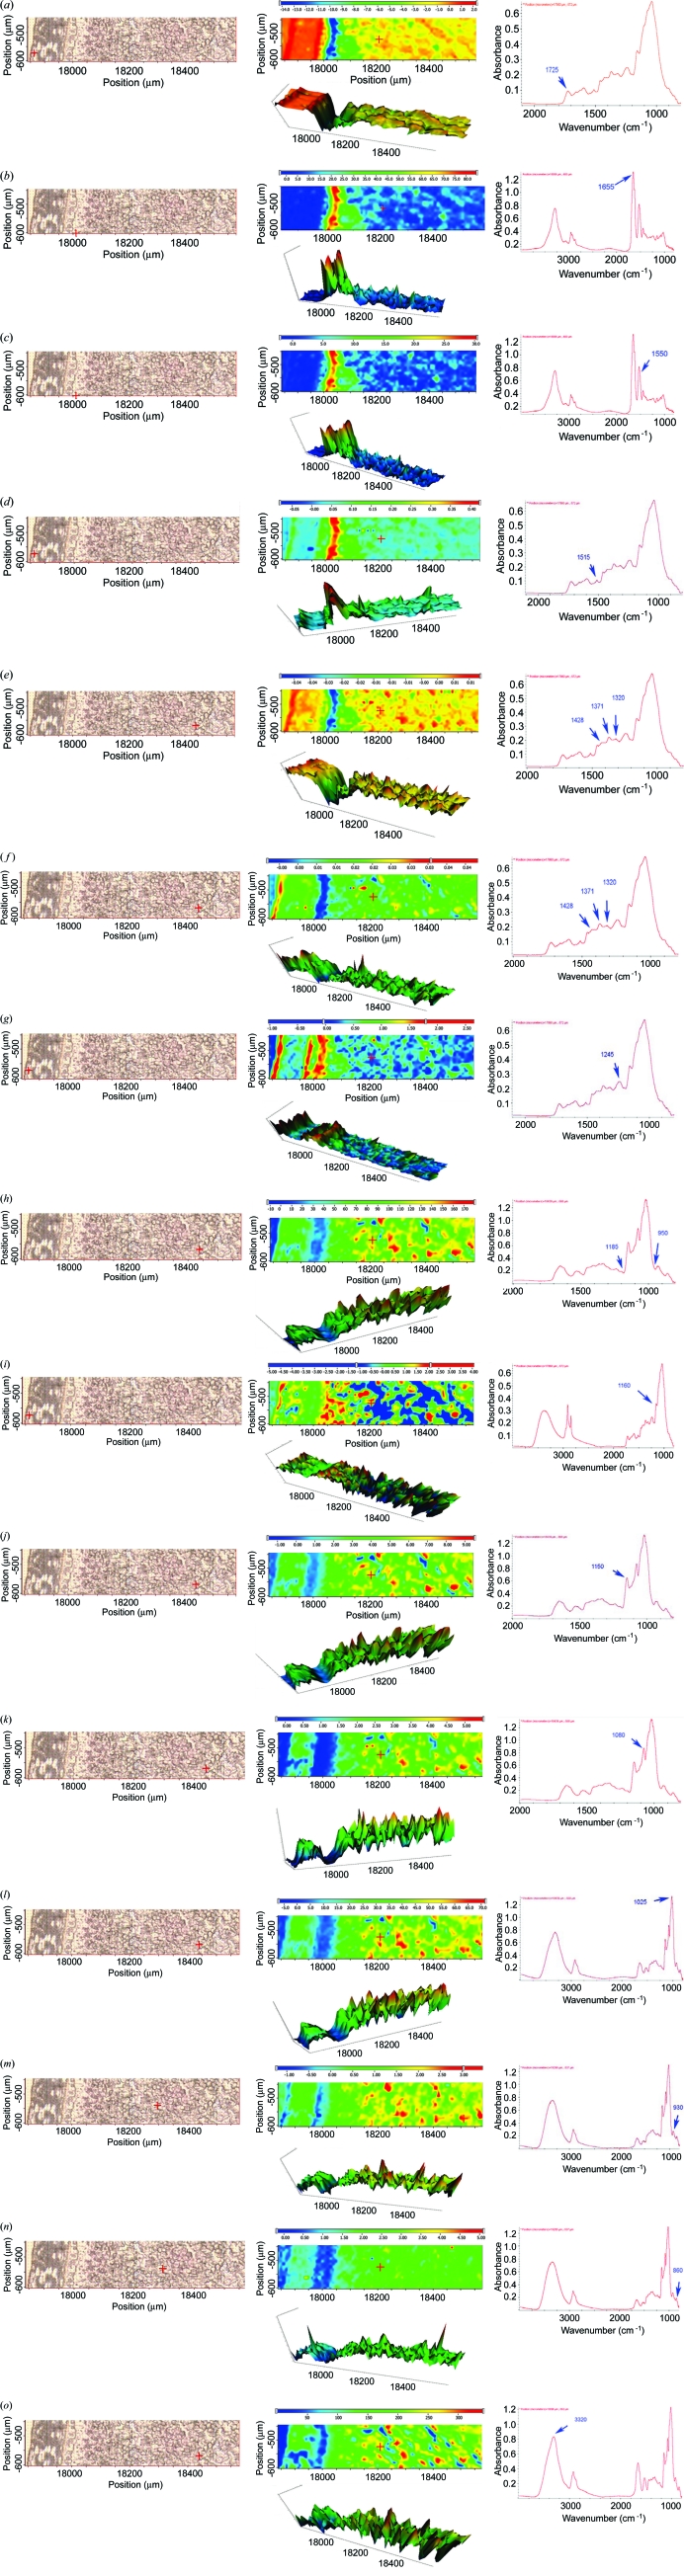
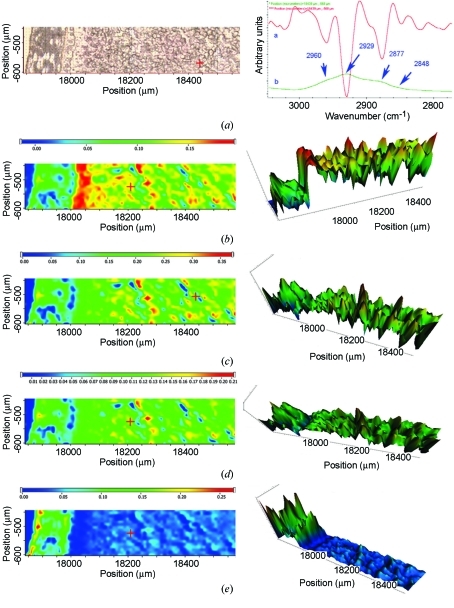
Sorghum seed (Sorghum bicolor L.) has unique degradation and fermentation behaviours compared with other cereal grains such as wheat, barley and corn. This may be related to its cell and cell-wall architecture. The advanced synchrotron radiation infrared microspectroscopy (SR-IMS) technique enables the study of cell or living cell biochemistry within cellular dimensions. The objective of this study was to use the SR-IMS imaging technique to microprobe molecular spatial distribution and cell architecture of the sorghum seed tissue comprehensively. High-density mapping was carried out using SR-IMS on beamline U2B at the National Synchrotron Light Source (Brookhaven National Laboratory, NY, USA). Molecular images were systematically recorded from the outside to the inside of the seed tissue under various chemical functional groups and their ratios [peaks at ∼1725 (carbonyl C=O ester), 1650 (amide I), 1657 (protein secondary structure α-helix), 1628 (protein secondary structure β-sheet), 1550 (amide II), 1515 (aromatic compounds of lignin), 1428, 1371, 1245 (cellulosic compounds in plant seed tissue), 1025 (non-structural CHO, starch granules), 1246 (cellulosic material), 1160 (CHO), 1150 (CHO), 1080 (CHO), 930 (CHO), 860 (CHO), 3350 (OH and NH stretching), 2960 (CH(3) anti-symmetric), 2929 (CH(2) anti-symmetric), 2877 (CH(3) symmetric) and 2848 cm(-1) (CH(2) asymmetric)]. The relative protein secondary structure α-helix to β-sheet ratio image, protein amide I to starch granule ratio image, and anti-symmetric CH(3) to CH(2) ratio image were also investigated within the intact sorghum seed tissue. The results showed unique cell architecture, and the molecular spatial distribution and intensity in the sorghum seed tissue (which were analyzed through microprobe molecular imaging) were generated using SR-IMS. This imaging technique and methodology has high potential and could be used for scientists to develop specific cereal grain varieties with targeted food and feed quality, and can also be used to monitor the degree of grain maturity, grain damage, the fate of organic contaminants and the effect of chemical treatment on plant and grain seeds.


Figures

Figure 1
Figure 1
Photomicrograph of the cross section of sorghum (6 µm) showing the intrinsic structure of sorghum from pericarp (A: outside of seed), seed coat (B), aleurone layer (C), endosperm (D) and sub-aleurone endosperm (E).
Figure 2
Figure 2
Molecular functional group images of the sorghum seed tissue from the pericarp (outside), seed coat, aleurone layer and endosperm [from left to right: visible image; chemical image, peak area of one peak; spectrum corresponding to the pixel at the cross hair in the visible image (spectrum pixel size: 10 µm × 10 µm)], using synchrotron-based infrared microspectroscopy at the NSLS. (a) Area under the 1725 cm−1 peak (carbonyl C=O); (b) area under the 1655 cm−1 peak (amide I); (c) area under the 1650 cm−1 peak (amide II); (d) area under the 1515 cm−1 peak (aromatic compound); (e) height under the 1428 cm−1 peak (cellulosic compound); (f) height under the 1371 cm−1 peak (cellulosic compound); (g) area under the 1245 cm−1 peak (cellulosic materials); (h) area under the 1185–950 cm−1 peak (total CHO); (i) area under the 1160 cm−1 peak (CHO); (j) area under the 1150 cm−1 peak (CHO); (k) area under the 1080 cm−1 peak (CHO); (l) area under the 1025 cm−1 peak (starch); (m) area under the 930 cm−1 peak (CHO); (n) area under the 860 cm−1 peak (CHO); (o) area under the 3350 cm−1 peak (OH and NH: protein and CHO).
Figure 3
Figure 3
(a) CH functional group images of the sorghum seed tissue from the pericarp (outside), seed coat, aleurone layer and endosperm. Left: visible image. Right: spectra corresponding to the pixel at the cross hair in the visible image. Spectrum pixel size: 10 µm × 10 µm. (b) CH3 anti-symmetric stretch at ∼2960 cm−1; (c) CH2 anti-symmetric stretch at ∼2929 cm−1; (d) CH3 symmetric stretch at ∼2877 cm−1; (e) CH2 asymmetric stretch at ∼2848 cm−1. Left, for (b)–(e): visible image; right: chemical image, peak height of one peak.
Figure 4
Figure 4
Molecular functional group peak area ratio. Peak height under the CH3 asymmetric stretch at ∼2960 cm−1 divided by the height under the peaks of the CH2 asymmetric stretch at ∼2929 cm−1 at each pixel (pixel size 10 µm × 10 µm), representing the anti-symmetric CH3 to CH2 ratio in the sorghum seed tissue. (a) Visible image. (b) Spectra corresponding to the pixel at the cross hair in the visible image. (c) Chemical ratio image: anti-symmetric CH3 to CH2 ratio. (d) Region and baseline: anti-symmetric CH3 and CH2. (e) Three-dimensional image; peak height ratio of two peaks. (f) Ratio image profile set-up.
Figure 5
Figure 5
Molecular functional group peak area ratio. Height under the protein α-helix (∼1657 cm−1) bands divided by the height under the peaks of the β-sheet (∼1628 cm−1) bands at each pixel (pixel size 10 µm × 10 µm), representing the α-helix to β-sheet ratio in the sorghum seed tissue. (a) Visible image. (b) Spectra corresponding to the pixel at the cross hair in the visible image. (c) Chemical ratio image: α-helix (1657 cm−1) to β-sheet (1628 cm−1). (d) Region and baseline: α-helix (1657 cm−1) to β-sheet (1628 cm−1). (e) Three-dimensional image; peak height ratio of two peaks. (f) Ratio image profile set-up.
Figure 6
Figure 6
Molecular functional group peak area ratio. Height under the protein amide I (1650 cm−1) bands divided by the height under the peaks between ∼1180 and 950 cm−1 at each pixel (pixel size 10 µm × 10 µm) representing the protein to total carbohydrate ratio in the sorghum seed tissue. (a) Visible image. (b) Spectra corresponding to the pixel at the cross hair in the visible image. (c) Chemical ratio image: protein to carbohydrate ratio. (d) Region and baseline of protein amide I and II and carbohydrate. (e) Three-dimensional image; peak height ratio of two peaks. (f) Ratio image profile set-up.

Similar articles

Cited by

References

    1. Bonwell, E. S., Fisher, T. L., Fritz, A. K. & Wetzel, D. L. (2008). Vib. Spectrosc. 48, 76–81.
    1. Budevska, B. O. (2002). Handbook of Vibrational Spectroscopy, Vol. 5, Applications of Vibrational Spectroscopy in Life, Pharmaceutical and Natural Sciences, edited by J. M. Chalmers and P. R. Griffiths, pp. 3720–3732. New York: John Wiley and Sons.
    1. Burattini, E., Cavagna, M., Dell’Anna, R., Malvezzi Campeggi, F., Monti, F., Rossi, F. & Torriani, S. (2008). Vib. Spectrosc. 47, 139–147.
    1. Chan, K. L., Tay, F. H., Taylor, C. & Kazarian, S. G. (2008). Appl. Spectrosc. 62, 1041–1044. - PubMed
    1. CLS (2010). What is a Synchrotron Anyway?, http://www.lightsource.ca/education/whatis.php.

Publication types