. 2011 Jul-Sep;5(3):215-27.
doi: 10.4161/pri.5.3.16936. Epub 2011 Jul 1.

Early behavioral changes and quantitative analysis of neuropathological features in murine prion disease: stereological analysis in the albino Swiss mice model

Affiliations

Early behavioral changes and quantitative analysis of neuropathological features in murine prion disease: stereological analysis in the albino Swiss mice model

Roseane Borner et al. Prion. 2011 Jul-Sep.

Abstract

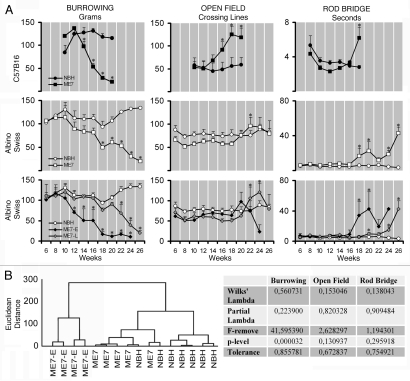
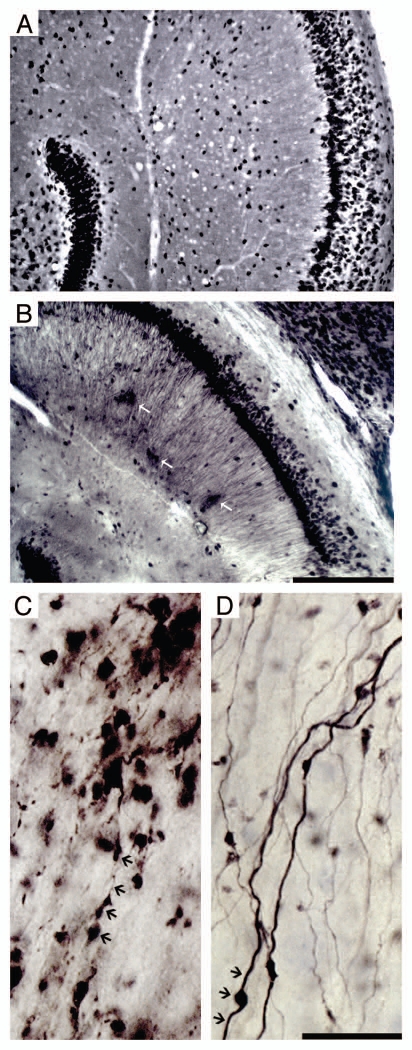
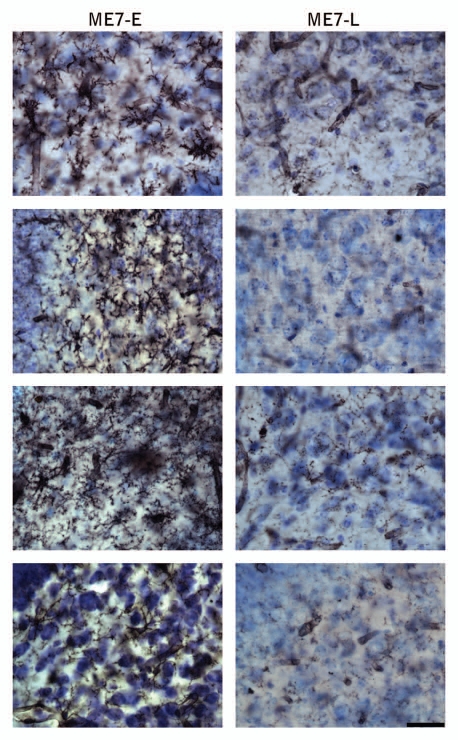
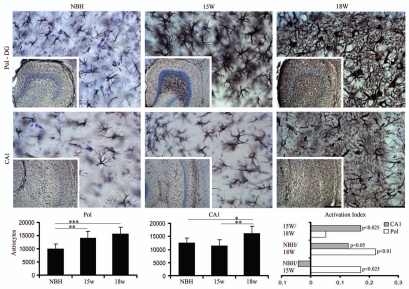
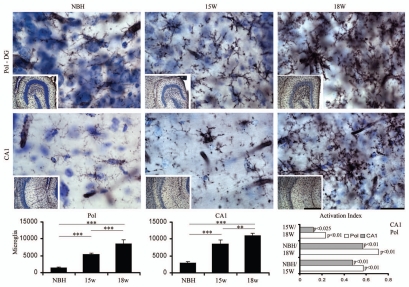
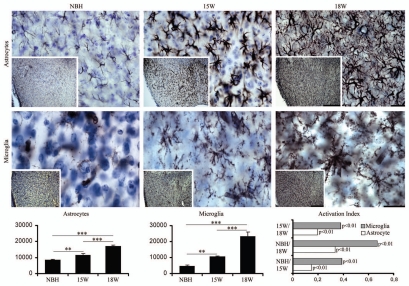
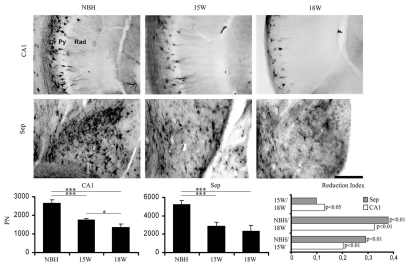
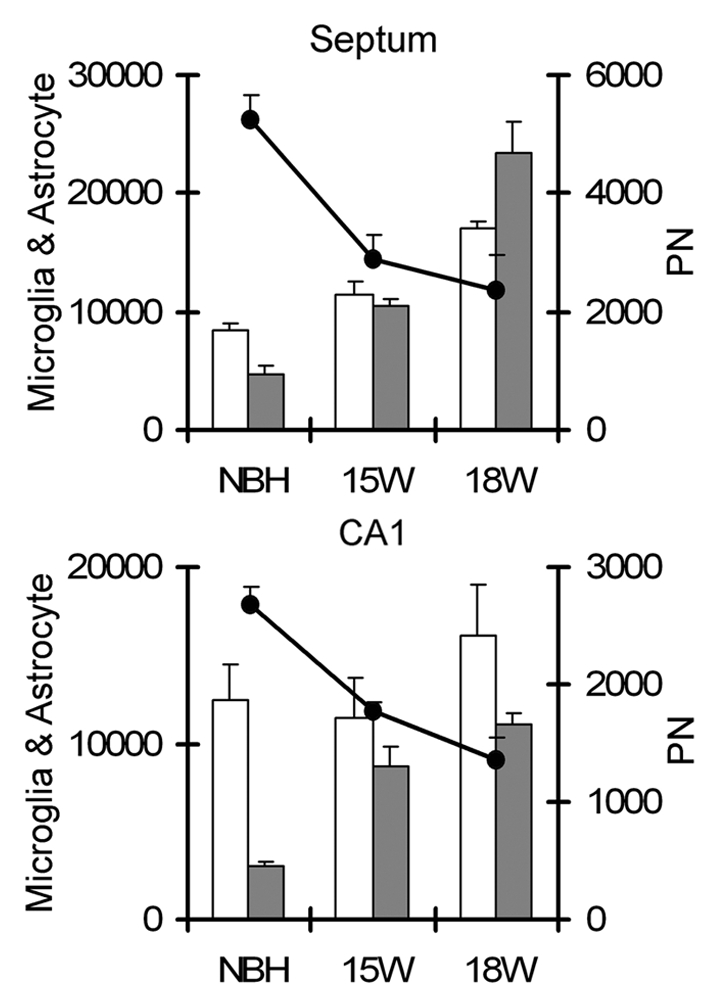
Behavioral and neuropathological changes have been widely investigated in murine prion disease but stereological based unbiased estimates of key neuropathological features have not been carried out. After injections of ME7 infected (ME7) or normal brain homogenates (NBH) into dorsal CA1 of albino Swiss mice and C57BL6, we assessed behavioral changes on hippocampal-dependent tasks. We also estimated by optical fractionator at 15 and 18 weeks post-injections (w.p.i.) the total number of neurons, reactive astrocytes, activated microglia and perineuronal nets (PN) in the polymorphic layer of dentate gyrus (PolDG), CA1 and septum in albino Swiss mice. On average, early behavioral changes in albino Swiss mice start four weeks later than in C57BL6. Cluster and discriminant analysis of behavioral data in albino Swiss mice revealed that four of nine subjects start to change their behavior at 12 w.p.i. and reach terminal stage at 22 w.p.i and the remaining subjects start at 22 w.p.i. and reach terminal stage at 26 w.p.i. Biotinylated dextran-amine BDA-tracer experiments in mossy fiber pathway confirmed axonal degeneration, and stereological data showed that early astrocytosis, microgliosis and reduction in the perineuronal nets are independent of a change in the number of neuronal cell bodies. Statistical analysis revealed that the septal region had greater levels of neuroinflammation and extracellular matrix damage than CA1. This stereological and multivariate analysis at early stages of disease in an outbred model of prion disease provided new insights connecting behavioral changes and neuroinflammation and seems to be important to understand the mechanisms of prion disease progression.


Figures

Figure 1
Figure 1
(A) Graphic representation of the behavioral changes in C57BL6 and albino Swiss mice models of prion disease. Left, middle and right columns correspond to burrowing, open field and rod bridge performances. Top and middle rows illustrate average values to C57BL6 and albino Swiss whereas bottom row illustrate two different subgroups (ME7-E) and (ME7-L) that start to behavioral deficits early and late respectively. (B) Cluster and discriminant analysis at 18 w.p.i. to demonstrate the presence of distinct sensitivity to ME7 agent. Note that on average C57BL6 start to change burrowing at 12 w.p.i. whereas albino Swiss mice only start 4 weeks later. ME7-E start at the same time as C57BL6, whereas ME7-L 10 weeks later. Open field activity starts to increase on average at 16 w.p.i. in C57Bl6 whereas in albino Swiss mice start 6 weeks later. C57BL6 and albino Swiss mice show the onset of impairments of motor coordination at the same time (18 w.p.i.). Despite statistical significant differences between ME7-animals and NBH-animals, cluster analysis did not detect subgroups in the open field and rod bridge performances.
Figure 2
Figure 2
Photomicrographs of hippocampal region of ME7 subjects at 18 w.p.i. after Neu-N (A) and PrP (B) immunohistochemistry to illustrate vacuoles and PrPSc deposits (white arrows) respectively. Photomicrographs of ME7-animal (C) and NBH-animal (D) mossy fibers at 18 w.p.i. Black arrows indicate damaged axons with boutons tumefaction, and reduction of the axonal filling in the ME7 infected brain whereas in the NBH-animal these signs are not present. Scale bars: (A and B) 250 µm; (C and D) 25 µm.
Figure 3
Figure 3
Photomicrographs of the polymorphic layer of dentate gyrus of ME7 subjects at 12 w.p.i. after Lycopersicum esculentum histochemistry (n = 9) to illustrate microglial activation early in the disease. Right column show early microglial activation in 4 infected subjects (ME7-E) as compared with 4 subjects without early microglia activation (left column, ME7-L). Scale bar: 25 µm.
Figure 4
Figure 4
Top and bottom: low and high power photomicrographics of the polymorphic layer of dentate gyrus (PolDG) and CA1 of GFAP immunostained sections after 15 or 18 w.p.i. Graphic representations illustrate the mean values and error bars of the total number of astrocytes in the PolDG (left) and CA1 (middle) and of the activation index (right) of reactive astrocytes in CA1 and polymorphic layer. Activation index was estimated by the following equation AI18/NBH = (ME718w − NBH)/(ME718w + NBH) or AI18/15 = (ME718w − ME715w)/(ME718w + ME7 15w) or AI15/NBH = (ME715w − NBH)/(ME715w + NBH) where AI is the activation index in the period and ME718w, ME715w and NBH are the estimates of the number of objects of interest at 15 and 18 w.p.i. in each region for each experimental group. Significant differences are indicated by (*) and the probability values by p level; (*) = 0.05; (**) = 0.025; (***) = 0.01. Scale bars: Scale bars: low power 250 µm; high power 25 µm.
Figure 5
Figure 5
Top and bottom: low and high power photomicrographs of the polymorphic layer of dentate gyrus (Pol-DG) and CA1 of activated microglia stained with Lycopersicum esculentum histochemistry after 15 or 18 w.p.i. Graphic representations illustrate the mean values and error bars of the total number of activated microglia in the polymorphic layer of dentate gyrus (left) and CA1 (middle) and of the activation index (right) of microglia in CA1 and polymorphic layer. Activation index was estimated by the following equation AI18/NBH = (ME718w − NBH)/(ME718w + NBH) or AI18/15 = (ME718w − ME715w)/(ME718w + ME7 15w) or AI15/NBH = (ME715w − NBH)/(ME715w + NBH) where AI is the activation index in the period and ME718w, ME715w and NBH are the estimates of the number of objects of interest at 15 and 18 w.p.i. in each region for each experimental group. Significant differences are indicated by (*) and the probability values by p level; (*) = 0.05; (**) = 0.025; (***) = 0.01. Scale bars: Scale bars: low power 250 µm; high power 25 µm.
Figure 6
Figure 6
Septal region, low and high power, photomicrographs to illustrate GFAP (top) and Lycopersicum esculentum (bottom) reacted sections after 15 or 18 w.p.i. Graphic representations illustrate the mean values and error bars of the total number of astrocytes and activated microglia in the septal region and corresponding activation index. Activation index was estimated by the following equation AI18/NBH = (ME718w − NBH)/(ME718w + NBH) or AI18/15 = (ME718w − ME715w)/(ME718w + ME7 15w) or AI15/NBH = (ME715w − NBH)/(ME715w + NBH) where AI is the activation index in the period and ME718w, ME715w and NBH are the estimates of the number of objects of interest at 15 and 18 w.p.i. in each region for each experimental group. Significant differences are indicated by (*) and the probability values by p level; (*) = 0.05; (**) = 0.025; (***) = 0.01. Scale bars: Scale bars: low power 250 µm; high power 25 µm.
Figure 7
Figure 7
Top and middle: low and high power photomicrographs of CA1 and septum of sections stained for biotinylated Wisteria floribunda to demonstrate perineuronal nets after 15 or 18 w.p.i. of infected (15 w, 18 w) or normal brain (NBH) homogenates. Bottom: graphic representations of the mean and error bars estimations of the total number of perineuronal nets in CA1 (left) and septum (middle) and of the reduction index (right) of perineuronal nets in CA1 (white bars) and septum (grey bars). Reduction index was estimated by the following equation RINBH/18 = (ME718w − NBH)/(ME718w + NBH) or RI15/18 = (ME715w − ME718w)/(ME715w + ME7 18w) or RINBH/15 = (ME7NBH − ME715w)/(NBH + ME715w) where RI is the reduction index in the period and ME718w, ME715w and NBH are the estimations of the number of objects of interest at 15 and 18 w.p.i. of ME7 infected or normal brain (NBH) homogenates in each region for each experimental group. Significant differences are indicated by *p < 0.05 or **p < 0.01.
Figure 8
Figure 8
Overview of the total numbers of astrocytes, microglia and PN nets estimations in the septum (top) and CA1 (bottom). Note that the total number of perineuronal nets (PN) decrease along the disease progression whereas astrocytes and microglia increase. White and black columns correspond to astrocytes and microglia respectively whereas data points correspond to PN nets estimations.

Similar articles

Cited by

References

    1. Prusiner SB. Shattuck lecture—neurodegenerative diseases and prions. N Engl J Med. 2001;344:1516–1526. - PubMed
    1. Aguzzi A, Sigurdson C, Heikenwaelder M. Molecular mechanisms of prion pathogenesis. Annu Rev Pathol. 2008;3:11–40. - PubMed
    1. Chiti Z, Knutsen OM, Betmouni S, Greene JR. An integrated, temporal study of the behavioral, electrophysiological and neuropathological consequences of murine prion disease. Neurobiology of disease. 2006;22:363–373. - PubMed
    1. Cunningham CR, Deacon H, Wells D, Boche S, Waters CP, Diniz, et al. Synaptic changes characterize early behavioral changes in the ME7 model of murine prion disease. Eur J Neurosci. 2003;17:2147–2155. - PubMed
    1. Betmouni S, Perry VH. The acute inflammatory response in CNS following injection of prion brain homogenate or normal brain homogenate. Neuropathol Appl Neurobiol. 1999;25:20–28. - PubMed

LinkOut - more resources