. 2012 Jan;22(1):259-72.
doi: 10.1038/cr.2011.139. Epub 2011 Aug 23.

The critical role of CD133(+)CD44(+/high) tumor cells in hematogenous metastasis of liver cancers

Affiliations

The critical role of CD133(+)CD44(+/high) tumor cells in hematogenous metastasis of liver cancers

Ying Hou et al. Cell Res. 2012 Jan.

Abstract

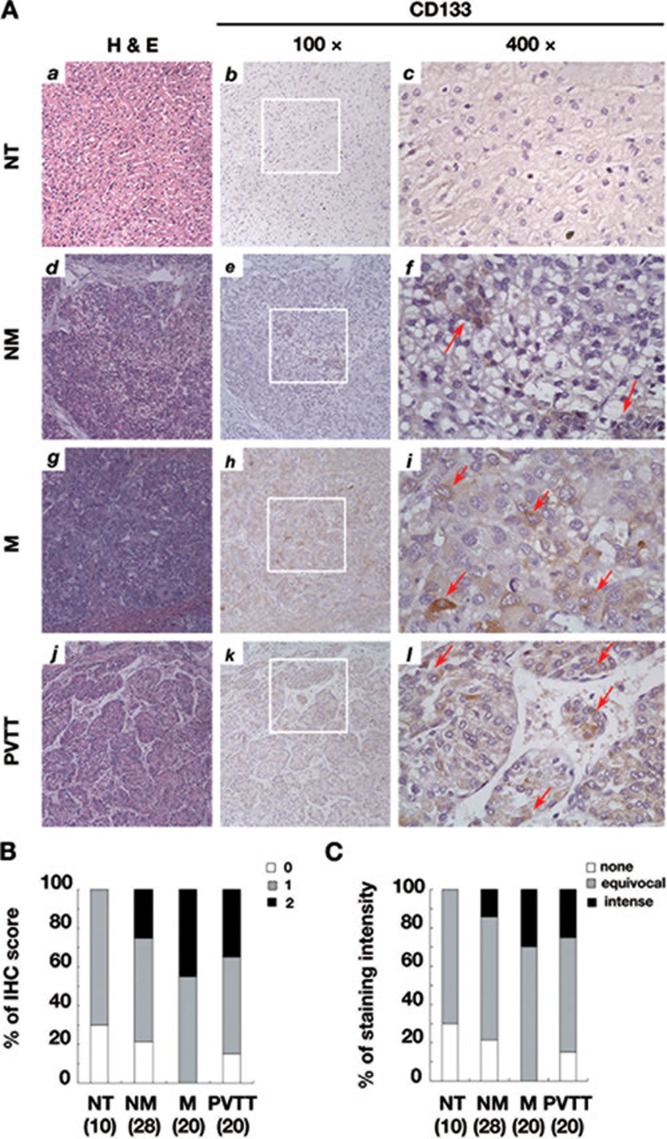
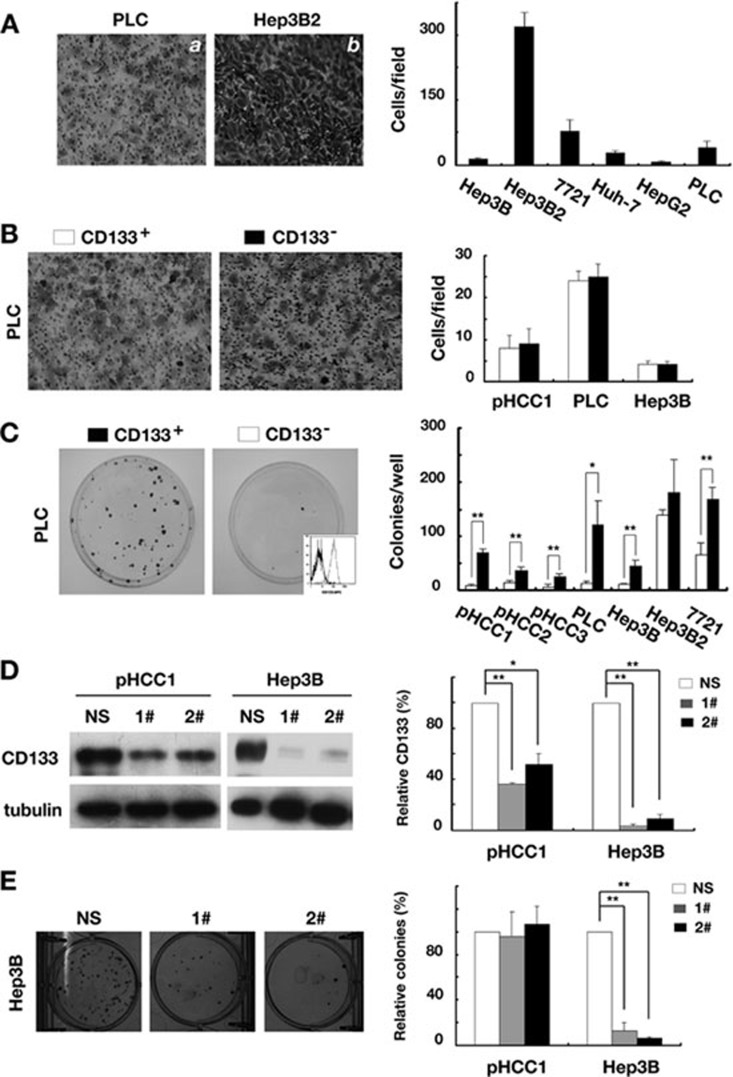
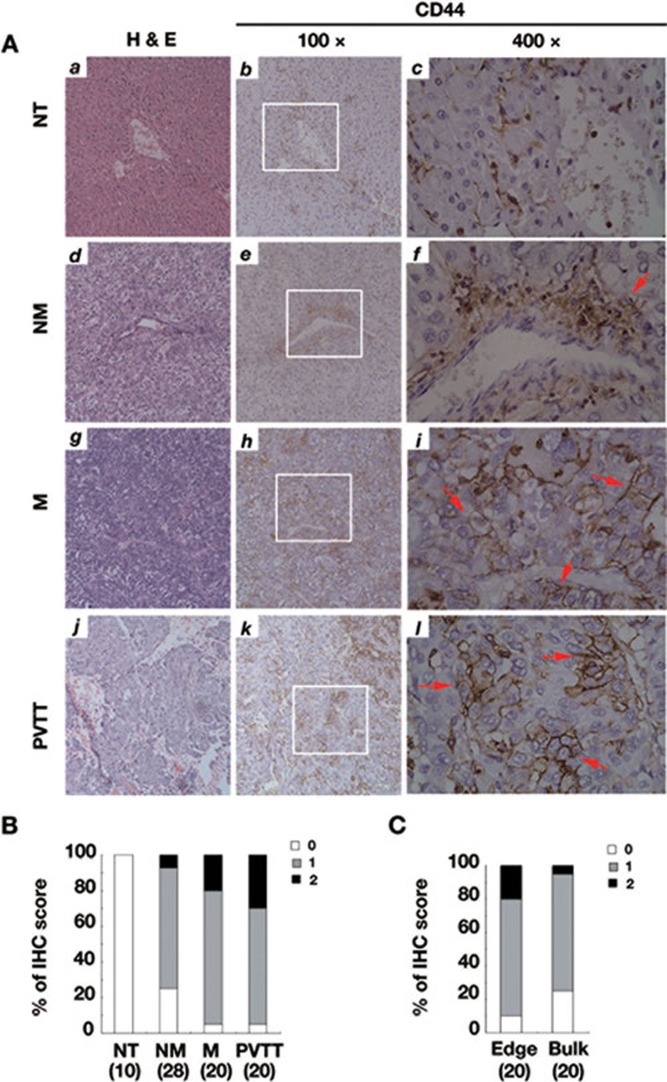
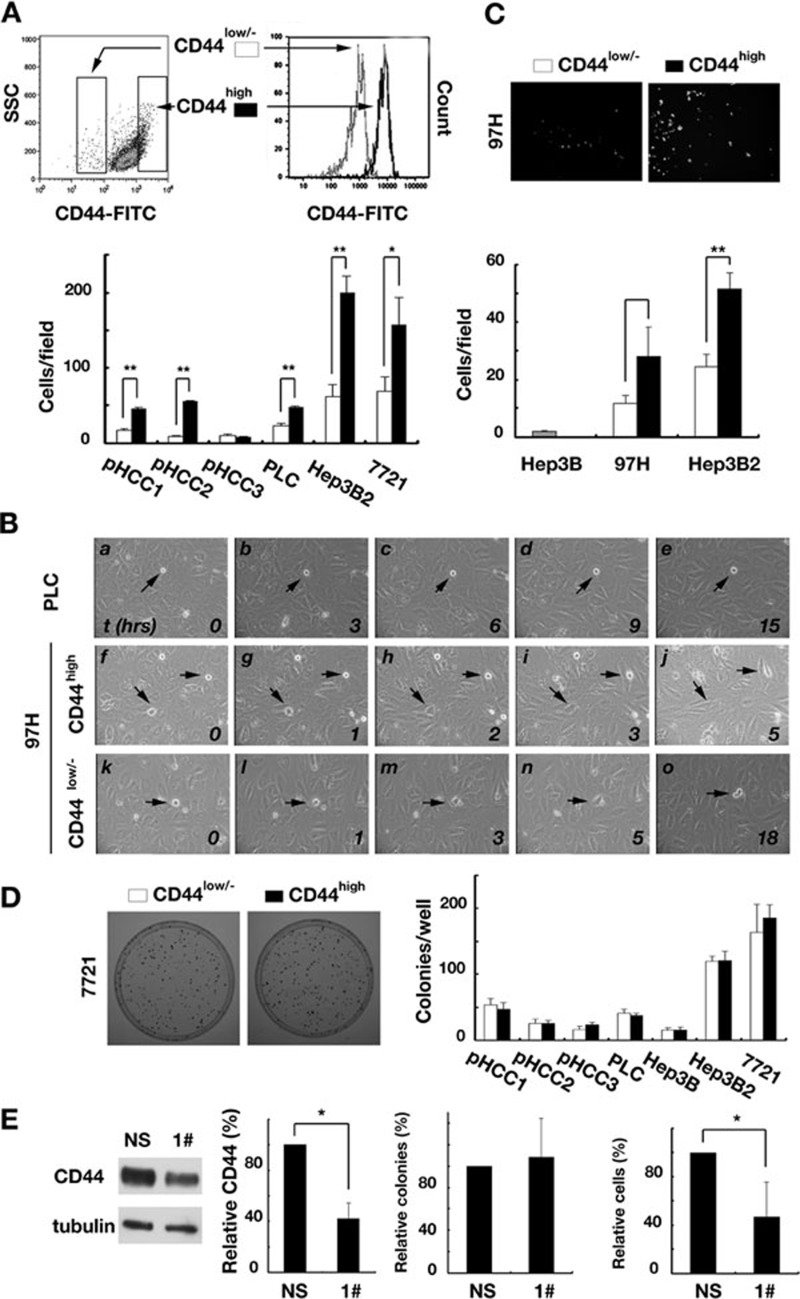
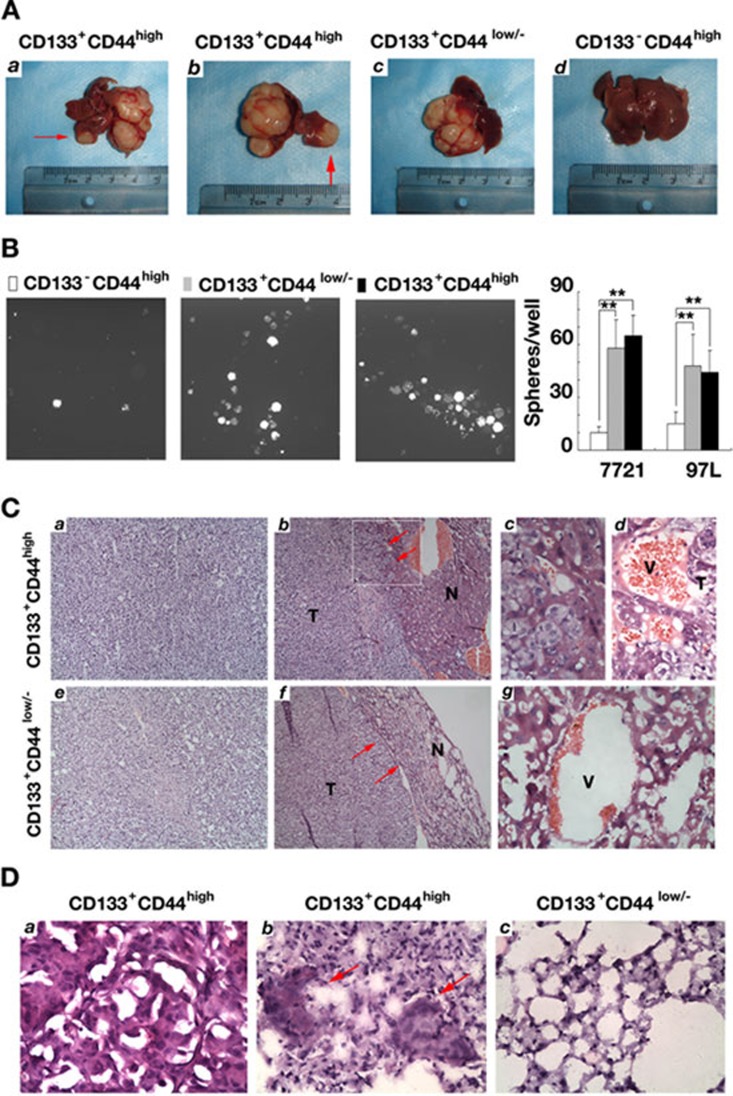
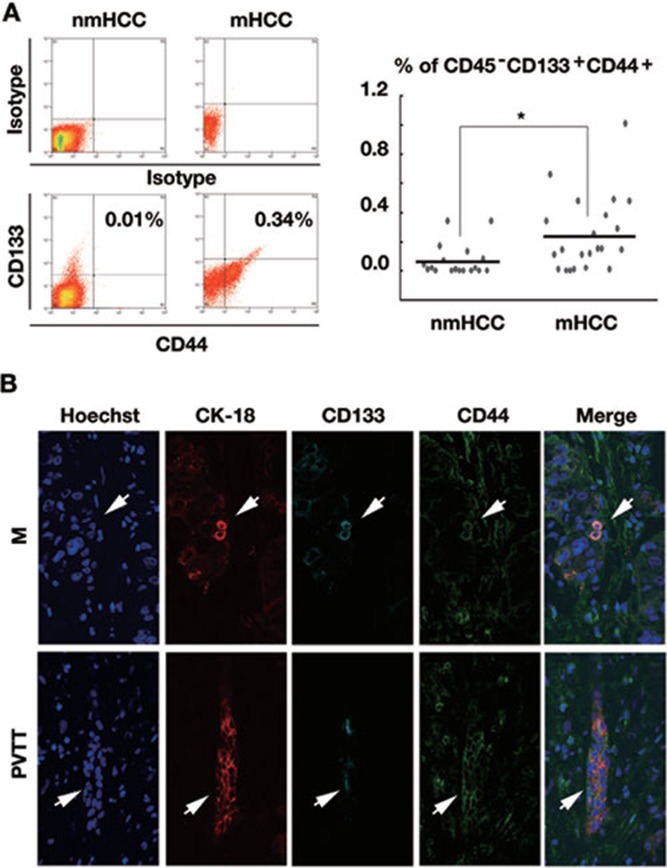
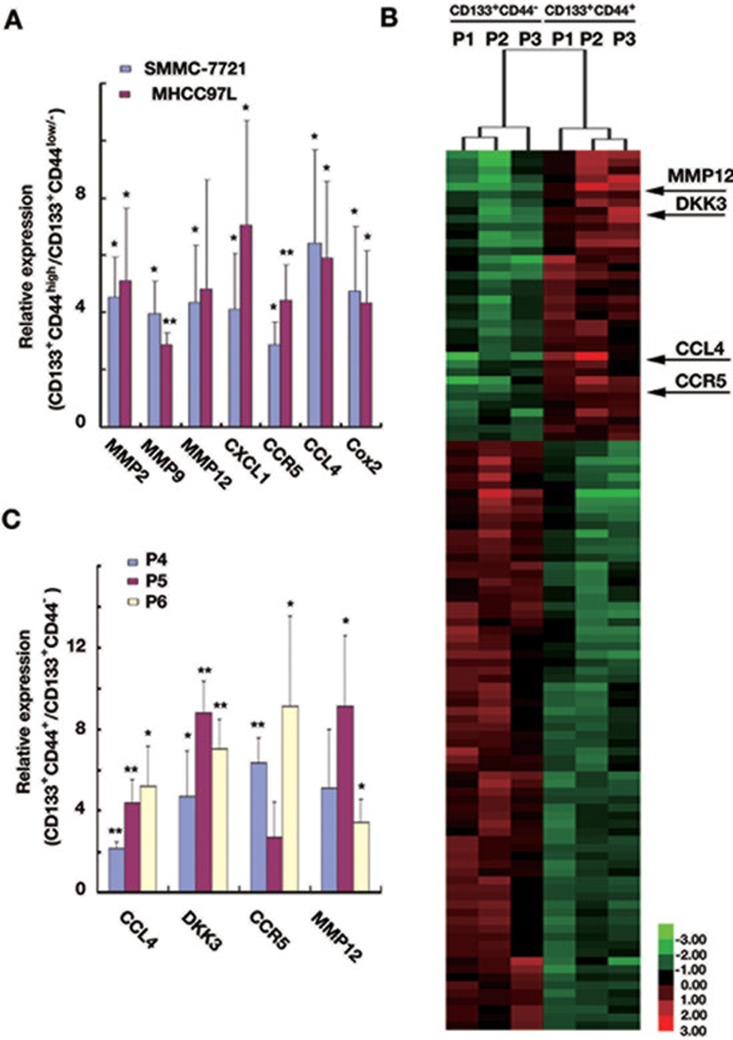
Metastatic hepatocellular carcinoma (HCC) is one of the most lethal cancers worldwide. However, the cell population responsible for its metastasis remains largely unknown. Here, we reported that CD133(+)CD44(+/high) defined a subgroup of tumor cells that was responsible for hematogenous metastasis of liver cancers. Immunohistochemical investigation of human HCC specimens revealed that the number of CD133(+) and CD44(+) HCC cells was increased and was associated with portal vein invasion. Purified CD133(+) or CD44(high) HCC cells were superior in clonogenic growth and vascular invasion, respectively. Thus, the combination of CD133 and CD44 was used to define a novel HCC sub-population. CD133(+)CD44(high), but not CD133(+)CD44(low/-), CD133(-)CD44(high) or CD133(-)CD44(low/-) xenografts, produced intrahepatic or lung metastasis in nude mice. Further analysis of human HCC samples by flow cytometry showed that the number of CD133(+)CD44(+) tumor cells was associated with portal vein metastasis. The cDNA microarray analysis of CD133(+)CD44(+) and CD133(+)CD44(-) tumor cells isolated from metastatic HCC patients revealed that these cells comprised of two different populations possessing distinct gene expression profiles. Our results suggest that CD133(+)CD44(+) tumor cells are a particular population responsible for hematogenous metastasis in liver cancers and that these cells might be targets for treatment of HCC metastasis.


Figures

Figure 1
Figure 1
CD133 expression was associated with vascular invasion in liver cancers. (A) Representative images of H&E or CD133 staining in normal liver tissues (NTs, a-c), HCC specimens without metastasis (NM, d-f), primary tumors of metastatic HCC (M, g-i) and portal vein tumor thrombus (PVTT, j-l). Panels c, f, i and l are the enlarged images of the areas within the rectangles in b, e, h and k, respectively. Arrows in f, i and l indicate CD133+ tumor cells. Original magnification, 100× (a, b, d, e, g, h, j, k); 400× (c, f, i, l). (B) Statistics regarding the CD133 IHC scores (P = 0.037, M vs NM; P = 0.002, M vs NT; and P = 0.267, M vs PVTT) (C) Statistics regarding the CD133 staining intensities (P = 0.030, M vs NM; P = 0.005, M vs NT; and P = 0.318, M vs PVTT).
Figure 2
Figure 2
CD133+ tumor cells were superior in clonogenic growth but not in invasion. (A) Representative images of invaded HCC cells in transwell assays (100× left) and the related statistics (right). PLC, PLC8024; 7721 and SMMC-7721. (B) Representative images of invaded CD133+ and CD133 PLC8024 cells (100×) in transwell assays (left) and the related statistics (right). (C) Representative images of colonies formed from sorted PLC8024 cells (left) and the related statistics (right). The flow cytometry plot shown in a is isolated CD133+ (gray) and CD133 cells (black). (D) Western blotting of CD133 levels in pHCC1 and Hep3B cells infected with virus of non-sense (NS) or RNAi no. 1 and no. 2 against CD133 (left), and the statistics related to CD133 levels normalized to α-tubulin (right). (E) Representative images of colonies formed from infected Hep3B cells (left) and the related statistics (right). All results are expressed as mean ± SD from at least three independent experiments. *P < 0.05 and **P < 0.01.
Figure 3
Figure 3
CD44 expression was associated with vascular invasion in liver cancers. (A) Representative images of H&E or CD44 staining in normal liver tissues (NTs, a-c), HCC specimens without metastasis (NM, d-f), primary tumors of metastatic HCC (M, g-i) and portal vein tumor thrombus (PVTT, j-l). Panels c, f, i and l are the enlarged images of the areas enclosed in the rectangles in b, e, h and k, respectively. Arrows in f, i and l indicate CD44+ tumor cells. Original magnification, 100× (a, b, d, e, g, h, j, k); 400× (c, f, i, l). (B) Statistics related to the CD44 IHC scores (P=0.038, M vs NM; P < 0.001, M vs NT; and P = 0.521, M vs PVTT). (C) Statistics related to the CD44 IHC score in the tumor bulk or edge (P = 0.037 vs tumor edge).
Figure 4
Figure 4
CD44high HCC cells were superior in vascular invasion but not in clonogenic growth. (A) The scheme to isolate CD44high and CD44low/− HCC cells (upper left), the purity of the isolated subsets (upper right) and statistics regarding the invasiveness of sorted HCC cells (lower). PLC, PLC8024; 7721, SMMC-7721. (B) Representative time-lapse images of PLC8024 cells (a-e), isolated CD44high (f-j), CD44low/− (k-o) and MHCC97H (97H) cells co-cultured with HUVEC cells at the indicated times (lower right). Arrows indicate tumor cells under observation. (C) Representative images of transmigrated MHCC97H cells (100×) in the transendothelial migration assay (left) and related statistics (right) (D) Representative images of colonies formed from sorted CD44high and CD44low/− cells (left) and related statistics (right). (E) Western blotting of CD44 levels in Hep3B2 cells infected with virus containing non-sense (NS) or RNAi no. 1 against CD44 and statistics related to the CD44 levels normalized to α-tubulin (left). Statistics related to colony formation or cell invasion of infected Hep3B2 cells (right). All results are expressed as mean ± SD from at least three independent experiments. *P < 0.05 and **P < 0.01.
Figure 5
Figure 5
CD133+CD44high HCC cells were responsible for tumor metastasis. (A) Representative images of tumor formation in the liver or intrahepatic metastatic nodules as indicated in nude mice implanted with sorted SMMC-7721 cells. (B) Representative images of cell spheres formed by sorted SMMC-7721 (left) and the related statistics (right) 7721 (SMMC-7721), 97L (MHCC97L). (C) Histological analysis of the tumor center (a, e), tumor border (b, f) and microvessels (d, g) in liver tumors, formed by sorted SMMC-7721 cells. Panel c is the enlarged image of the area enclosed by the rectangle in b. Original magnification, 100× (a, b, e, f); 400× (c, d, g). N, normal tissue; T, tumor; V, vessel. (D) Representative images of H&E staining (400×) in liver tumors or lung specimens from nude mice implanted with sorted MHCC97L. Arrows indicate micrometastasis in the lung. Liver tumor tissues are shown in a and lung tissues in b,c. All results are expressed as mean ± SD from at least three independent experiments. **P < 0.01.
Figure 6
Figure 6
More CD133+CD44+ tumor cells were found in metastatic than in metastasis-free HCC specimens. (A) Representative flow cytometry plot of CD45CD133+CD44+ cells in metastatic (mHCC) or metastasis-free (nmHCC) HCC samples (left) and the related statistics (right). Images of isotype labeling are in the upper left. (B) Representative images of CK18+CD133+CD44+ cells (400×), as indicated in the primary tumor (M) and portal vein tumor thrombus (PVTT). *P < 0.05.
Figure 7
Figure 7
CD133+CD44+ and CD133+CD44 cells were genetically different populations. (A) Comparison of gene expression levels between CD133+CD44high and CD133+CD44low/− SMMC-7721 or MHCC97L cells by real-time PCR. (B) The hierarchical cluster of differentially expressed probes in CD133+CD44+ and CD133+CD44 cells based on cDNA microarray analysis. Genes indicated were used for real-time PCR validation in samples isolated from three additional HCC patients with metastasis (P4, P5 and P6). (C) The Ct value of the CD133+CD44low/− (CD133+CD44) subgroup was used as the calibrator. *P < 0.05 or **P < 0.01 vs the CD133+CD44low/− (CD133+CD44) subgroup.

Similar articles

Cited by

References

    1. Pisani P, Parkin DM, Bray F, Ferlay J. Estimates of the worldwide mortality from 25 cancers in 1990. Int J Cancer. 1999;83:18–29. - PubMed
    1. Jin F, Xiang YB, Gao YT. Cancer survival in Shanghai, People's Republic of China. IARC Sci Publ. 1998;145:37–50. - PubMed
    1. Liang XH, Loncarevic IF, Tang ZY, Yu YQ, Zentgraf H, Schroder CH. Resection of hepatocellular carcinoma: oligocentric origin of recurrent and multinodular tumours. J Gastroenterol Hepatol. 1991;6:77–80. - PubMed
    1. Tsai TJ, Chau GY, Lui WY, et al. Clinical significance of microscopic tumor venous invasion in patients with resectable hepatocellular carcinoma. Surgery. 2000;127:603–608. - PubMed
    1. Hoshida Y, Villanueva A, Kobayashi M, et al. Gene expression in fixed tissues and outcome in hepatocellular carcinoma. N Engl J Med. 2008;359:1995–2004. - PMC - PubMed

Publication types

MeSH terms