. 2011 Aug 23:2:441.
doi: 10.1038/ncomms1455.

Active sampling and decision making in Drosophila chemotaxis

Affiliations

Active sampling and decision making in Drosophila chemotaxis

Alex Gomez-Marin et al. Nat Commun. .

Abstract

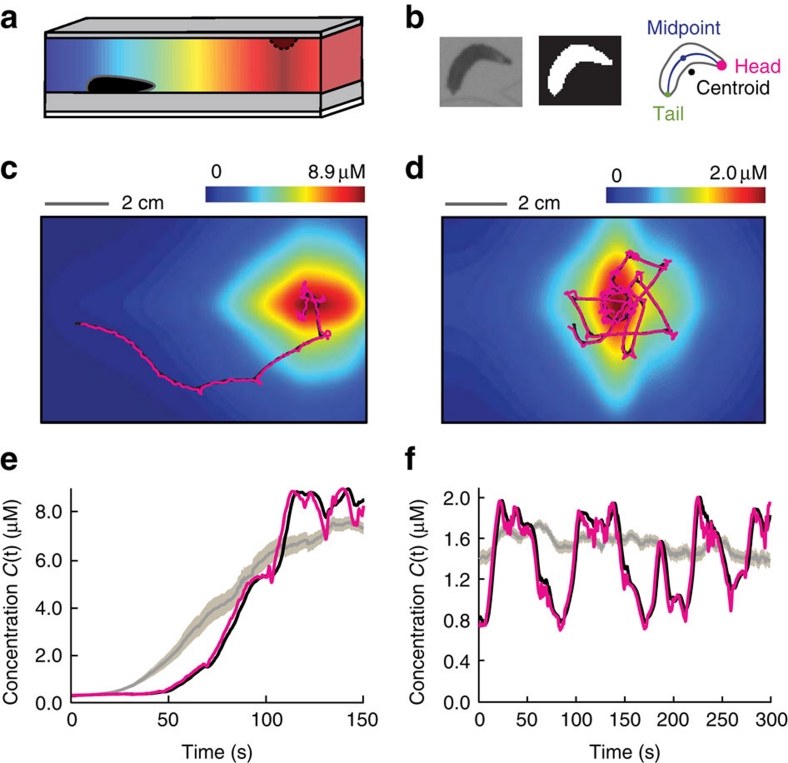
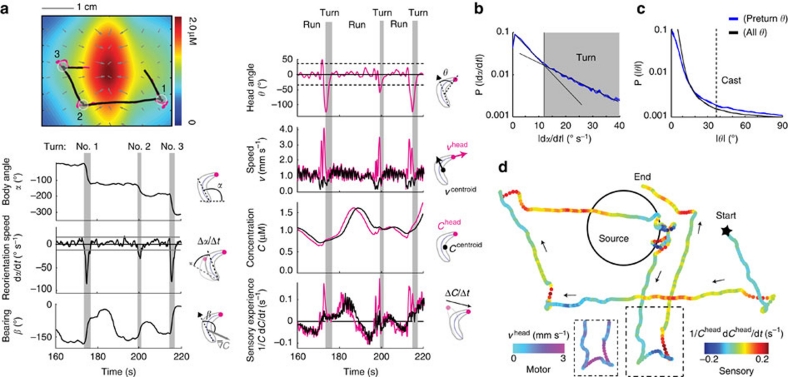
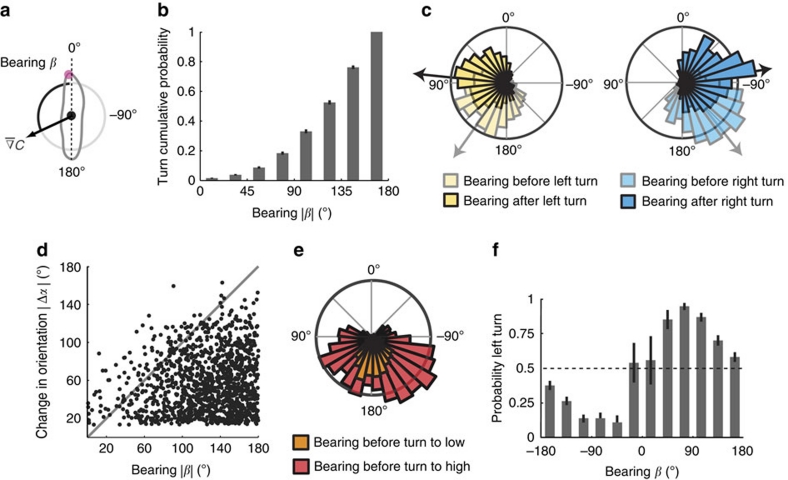
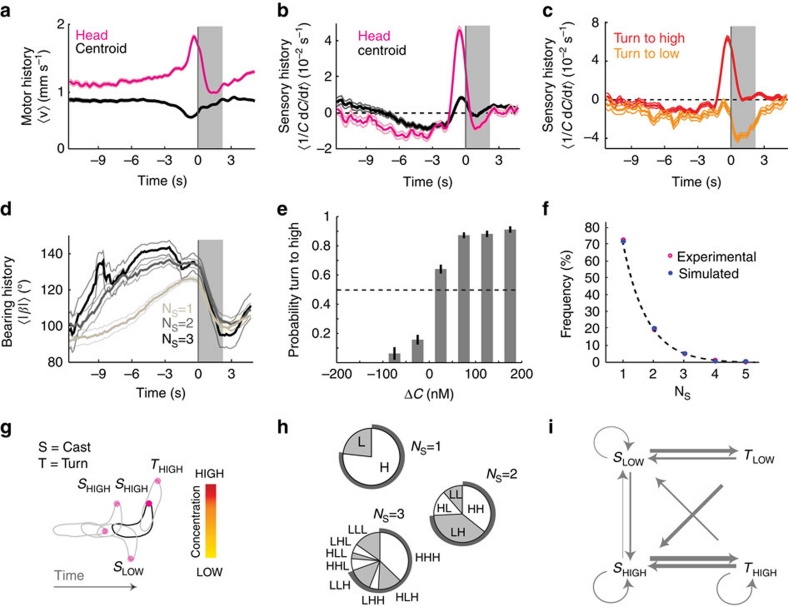
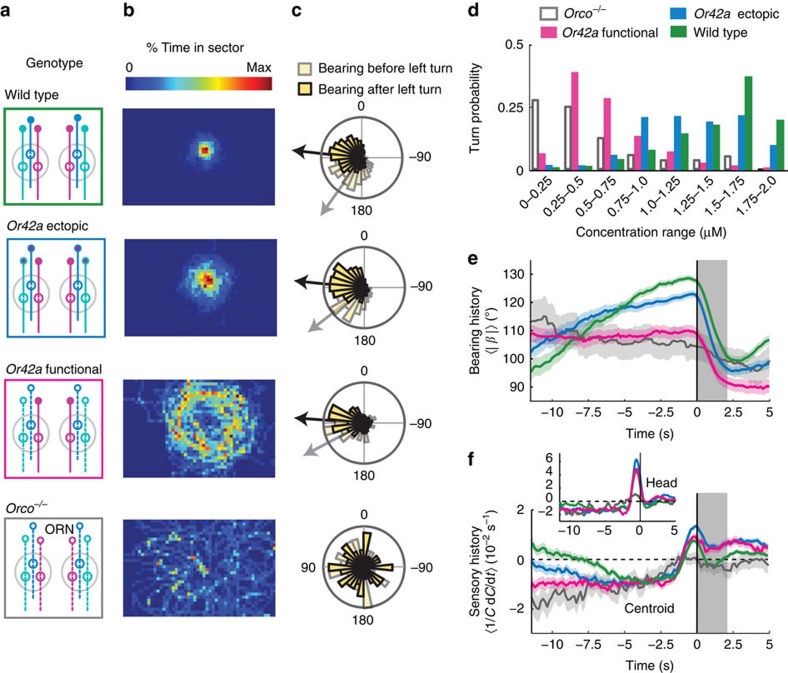
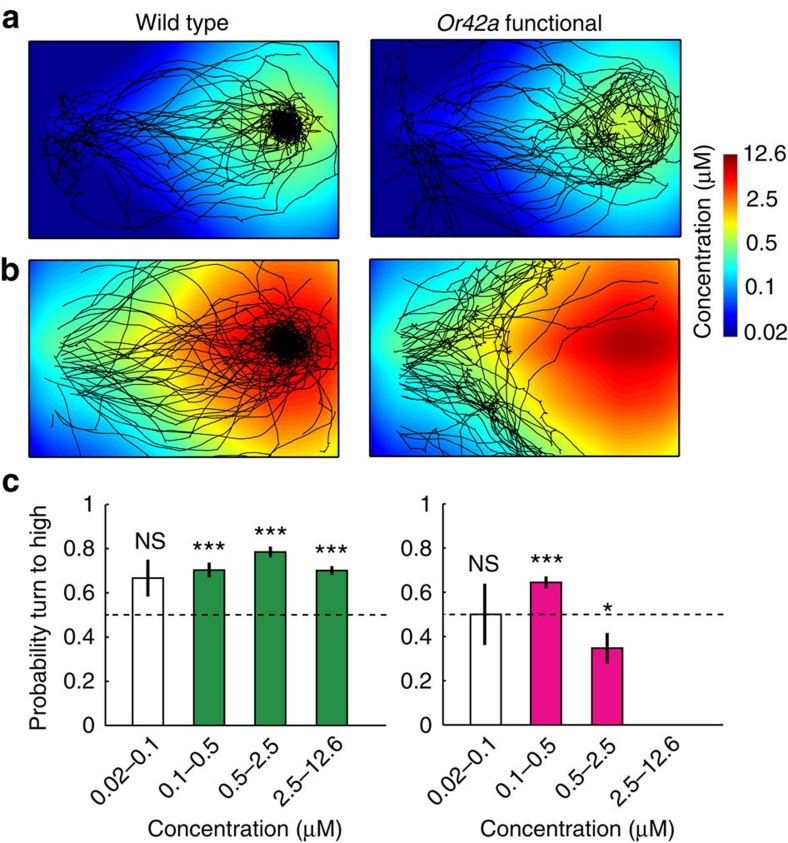
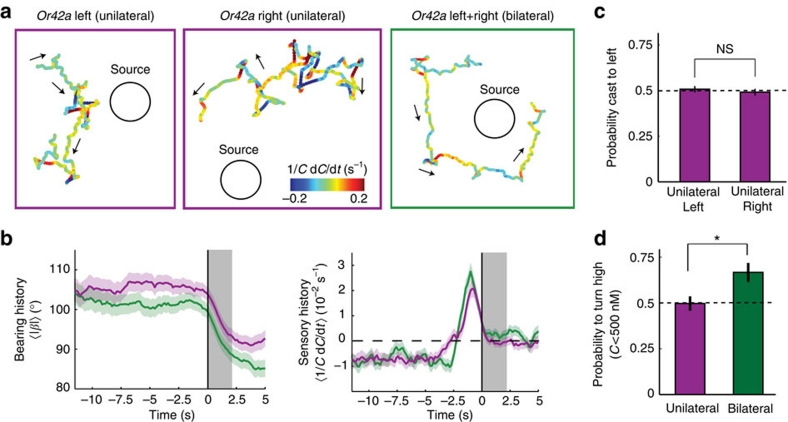
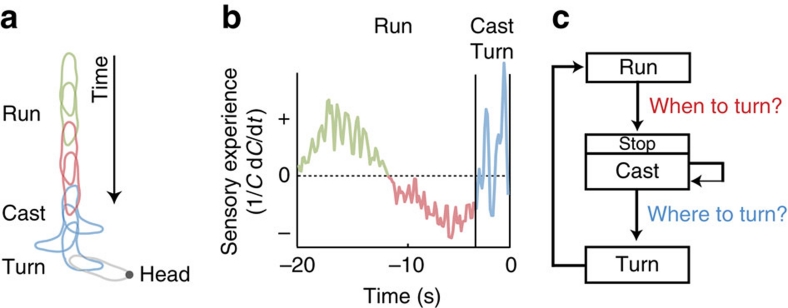
The ability to respond to chemical stimuli is fundamental to the survival of motile organisms, but the strategies underlying odour tracking remain poorly understood. Here we show that chemotaxis in Drosophila melanogaster larvae is an active sampling process analogous to sniffing in vertebrates. Combining computer-vision algorithms with reconstructed olfactory environments, we establish that larvae orient in odour gradients through a sequential organization of stereotypical behaviours, including runs, stops, lateral head casts and directed turns. Negative gradients, integrated during runs, control the timing of turns. Positive gradients detected through high-amplitude head casts determine the direction of individual turns. By genetically manipulating the peripheral olfactory circuit, we examine how orientation adapts to losses and gains of function in olfactory input. Our findings suggest that larval chemotaxis represents an intermediate navigation strategy between the biased random walks of Escherichia Coli and the stereo-olfaction observed in rats and humans.


Figures

Figure 1
Figure 1. High-resolution measurements of sensory input and motor output.
(a) Representation of the behavioural assay for Drosophila larval chemotaxis. (b) Schematic of the automated computer-vision tracking algorithm. (c) Fourier transform infrared spectroscopy reconstruction of the odour gradient overlaid with a representative trajectory of the head (magenta) and the centroid (black) while approaching a 125 mM source of ethyl butyrate. (d) Same as for (c) when orbiting near a 30 mM odour source. (e) Concentration time course measured at the head and centroid positions corresponding to the representative trajectory in (c). Population-averaged head concentration represented in the background as a grey curve (mean±s.e.m., N=43 flies). (f) Same as for (e) in the near-source conditions of (d) (N=42).
Figure 2
Figure 2. Kinematic variables and behavioural states.
(a) Trajectory segment in an odour gradient field and temporal evolution of its associated sensory-motor variables: body angle orientation (α), reorientation speed (dα/dt), bearing (β) of the animal with respect to the local odour gradient, head angle (θ), head and centroid speed (v), odour concentration (C) at the head and centroid, and temporal concentration changes (1/C·dC/dt) capturing sensory experience. Occurrence of turns (grey circles numbered from 1 to 3 in the trajectory segment) is indicated by vertical grey bars. (b) Definition of turns. The crossover in the reorientation speed distribution of the wild-type dataset (blue curve) provides a natural threshold to define turns (grey region) as |dα/dt|>ω*(ω*=12° s−1, see grey line in (a) for the reorientation speed). Dashed lines indicate estimated counting errors of the distributions based on a bootstrapping procedure. (c) Definition of head casts. The distribution of head angle across the wild-type dataset (black curve) is compared with the distribution obtained from the 4 s preceding a turn (blue curve). Large fluctuations in head angle are more frequent immediately before a turn, which allows to define discrete head casts as peaks in head angle for which |θ|>θ*(θ*=37°, see also dotted line in (a) for head angle). (d) Illustrative trajectory of the reconstructed concentration changes experienced by the head of a freely moving larva. The inset depicts head speed.
Figure 3
Figure 3. Temporal and directional control of turning events.
(a) Schematic representation of larval bearing with respect to the local odour gradient. (b) Cumulative probability of turns as a function of the absolute bearing angle. Turns are more likely to be triggered when larvae navigate down-gradient (|β|>90°). Error bars indicate s.e.m. (c) Distributions of bearing angles before (translucid) and after (opaque) turns, constrained to left (yellow) and right (blue) reorientations. (d) Absolute change in body orientation angle during turning events (|Δα|) as a function of the absolute bearing angle before turn initiation (|β|). Whereas larvae seem unable to precisely estimate the exact value of the bearing angle, the majority of turns do not overshoot the direction of the local gradient (diagonal). (e) Bearing distributions for turns towards high and low. Turns towards low are initiated at down-gradient orientations where spatial asymmetries in the odour gradient are more difficult to resolve via lateral head casts. (f) Probability to turn towards the left side as a function of the bearing before turn initiation. Vertical bars represent s.e.m. The accuracy of a turn is optimal for bearing close to 90°, where the odour gradient is perpendicular to the larva. For bearing angles close to 180 degrees, the turning direction tends to be random. For all panels, N=1,243 turns.
Figure 4
Figure 4. Stereotypical sensory-motor history associated with casts and turns.
(a) Turn-triggered averages of head and centroid speed (mean±s.e.m.). Grey bar shading in the turn-triggered plots indicate turning. (b) Average perceived changes in odour concentration aligned with turn initiation. Concentration decreases (negative values) precede the transition from run to turn. Turn initiation follows abrupt positive temporal changes in concentration measured at the head position. High-amplitude positive peaks are caused by active sampling during head casting. (c) Turn-triggered average of perceived stimulus changes clustered by turns towards high and low. Turns directed towards high are preceded by large stimulus increases. Turns directed towards low are preceded by low-contrast stimulus experiences. (d) Average time course of the bearing angle aligned with turn onset. The larger the bearing angle history before the turn, the larger the number of head casts (NS) before the implementation of a turn. (e) Probability to turn towards high as a function of the concentration change (ΔC) experienced during the last head cast before turning. Error bars indicate s.e.m. (f) Histogram of the number of head casts observed before turn execution. The distribution follows a negative exponential function (dashed line). (g) Diagram of the cast-and-turn motor dynamics coupled with a high-or-low sensory experience description. (h) Pie charts of head casting pattern sequences before turning calculated on experimental data: bouts of head cast towards high (H) and towards low (L). Head cast towards low concentrations is often followed by another head cast towards high. Patterns ending on high dominate. (i) Ethogram classification of odour-search behaviour into four elementary 'action–perception' states: turns (T) and head casts (S) towards low (L) and high (H). Illustration of the 4 behavioural states of the model. Transition probabilities between states calculated on the basis of a first-order Markov chain trained on the experimental data. Arrow thicknesses are proportional to the transition probabilities. Numerically simulated sequences of state transitions show an excellent fit with the experimentally measured exponential distribution of the number of head casts. For all panels, N=1,243 turns.
Figure 5
Figure 5. Navigational algorithm adaptation to genetic manipulations of peripheral olfactory inputs.
(a) Schematic of wild type and larvae with re-engineered peripheral olfactory circuits tested in the near-source paradigm (30 mM odour source): wild type (N=42 flies), Or42a ectopically expressed in the 21 intact ORNs (all neuron pairs active, N=38), Or42a single-functional ORN (one pair of neuron active, N=37), and Orco null (anosmic flies, N=55). (b) Time occupancy spatial maps (4 mm2 sectors) for each tested genotype. (c) Distribution of bearing angles before and after turns towards left. Circular means of bearings before (grey) and after (black) turns are represented as arrows. The amplitude of reorientation is modulated across genotypes. (d) Turning probability as a function of odour concentration. Or42a-ectopic larvae (N=951 turns) implement turns over a wider range of concentrations, whereas Or42a-functional (N=533) turn at much lower concentrations than wild type (N=1,243). (e) Turn-triggered averages of bearing angle (mean±s.e.m.). Grey bars indicate turns. (f) Comparison of turn-triggered sensory experience across genotypes. Whereas Or42a-ectopic larvae display the same trend as wild type with a reduced slope, Or42a-functional larvae tend to maintain a constant negative value.
Figure 6
Figure 6. Concentration-dependent switch between attraction and avoidance in Or42a-functional larvae.
(a) Wild type (N=43 flies) and Or42a-functional (N=42) trajectories superimposed on the concentration landscape reconstructed for the approach paradigm at a low-concentration source of ethyl butye (7.8 mM). Heat map displayed in logarithmic scale. (b) Same as for (a) with wild type (N=43) and Or42a-functional (N=42) tested in a low-concentration source (125 mM) gradient. (c) Probability of turning to high as a function of the concentration range. For absolute odour concentrations lower than 100 nM, turns lead to randomized reorientation. Wild type (N=1,172 turns) show attraction at all other concentration ranges, whereas Or42a-functional (N=455) switch from attraction to avoidance at concentrations close to 500 nM. Error bars indicate s.e.m. Differences of turning probabilities with chance were tested by a one-tailed one-sample t-test (*P<0.05; ***P<0.001; NS, not significant P>0.05).
Figure 7
Figure 7. Impairment of bilateral olfactory function reduces navigational accuracy.
Or42a-functional larvae with olfactory function restricted to the left side (N=47 flies), the right side (N=47), and both sides (N=56). (a) Representative trajectories of the reconstructed concentration time course measured at the head. (b) Turn-triggered average history of the bearing angle in Or42a-functional larvae with unilateral and bilateral functions (mean±s.e.m.). Grey bar shading indicates turning event. Unilateral tend to initiate turns for bearing larger than bilateral, suggesting a less reliable assessment of stimulus time course. Turn-triggered average history of perceived stimulus change at the head. The constant negative trend in unilateral larvae is interrupted earlier than in bilateral larvae, leading to higher active sampling activity before turn execution. (c) Unilateral left (N=848 casts) and right (N=714) larvae do not show biases in the probability of head casting towards the left side (one-tailed one-sample t-test against chance, P=0.68 and P=0.63 for left and right, respectively). In addition, the performances of unilateral left and right are not significantly different (one-tailed two-sample t-test, P=0.53). Error bars indicate s.e.m. (d) The probability of implementing a turn towards high at low concentrations is above chance in bilateral larvae (one-tailed one-sample t-test, P=0.002), whereas it is not significantly different from chance for unilateral larvae (one-tailed one-sample t-test, P=0.94). The performance of bilateral larvae are significantly higher than those of unilateral (one-tailed two-sample t-test, P=0.011, *P<0.05). Number of turns at positions where C<500 nM: N=165 for pooled unilateral and N=84 for bilateral.
Figure 8
Figure 8. Sensory-motor model for larval chemotaxis.
(a) Schematic of a trajectory segment consisting of a run followed by a turn. The sequence of body postures corresponds to forward locomotion oriented up-gradient (green) and down-gradient (red) followed by a series of head casts (blue) and a turn (gray). (b) Sensory experience associated with the trajectory segment depicted in (a). During up-gradient motion (green), the sensory experience detected at the larva's head region is positive. On motion down-gradient (red), the sensory experience is negative for several seconds, which triggers a transition from running to head casting (blue). Head casts are associated with short and contrasted changes in odour concentration. (c) Diagram of the basic computation and rules controlling larval navigation in odour gradients. Chemotaxis consists of two main types of decision: when and where to turn. Temporal control of transitions from run to turn implies low-pass filtering, differentiation and time integration of sensory input measured during forward locomotion. The directional control of individual turns is mediated by an active sampling mechanism based on head casting.

References

    1. Berg H. C. Motile behavior of bacteria. Phys. Today 53, 24–29 (2000).
    1. Pierce-Shimomura J. T., Morse T. M. & Lockery S. R. The fundamental role of pirouettes in Caenorhabditis elegans chemotaxis. J. Neurosci. 19, 9557–9569 (1999). - PMC - PubMed
    1. Thesen A., Steen J. B. & Doving K. B. Behaviour of dogs during olfactory tracking. J. Exp. Biol. 180, 247–251 (1993). - PubMed
    1. Rajan R., Clement J. P. & Bhalla U. S. Rats smell in stereo. Science 311, 666–670 (2006). - PubMed
    1. Porter J. et al. Mechanisms of scent-tracking in humans. Nat. Neurosci. 10, 27–29 (2007). - PubMed

Publication types

LinkOut - more resources