

Microevolution of sympatry: landscape genetics of hedgehogs Erinaceus europaeus and E. roumanicus in Central Europe
- PMID: 21863052
- PMCID: PMC3282391
- DOI: 10.1038/hdy.2011.67
Microevolution of sympatry: landscape genetics of hedgehogs Erinaceus europaeus and E. roumanicus in Central Europe
Abstract
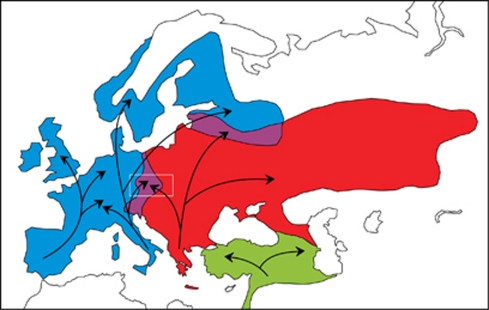
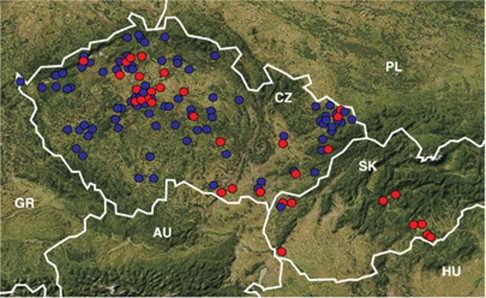
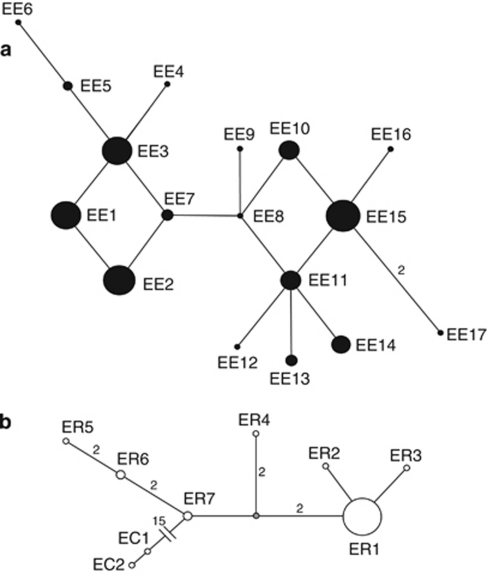
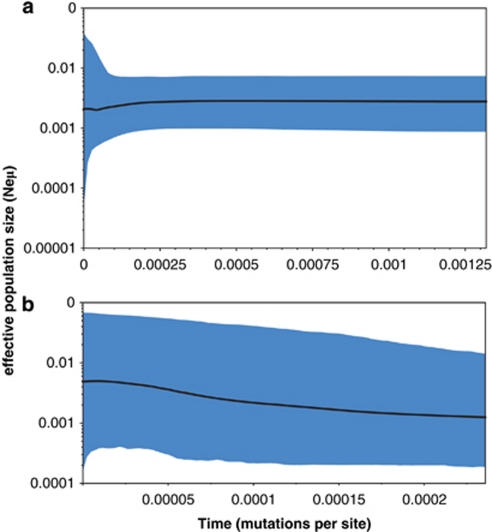
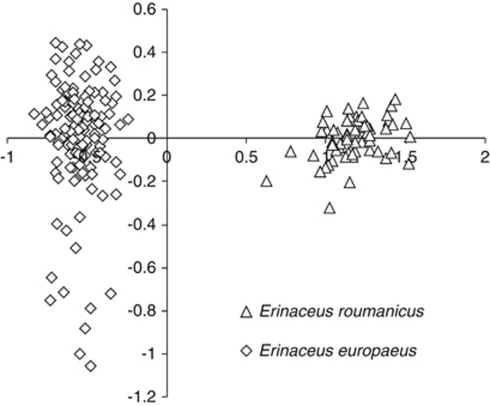
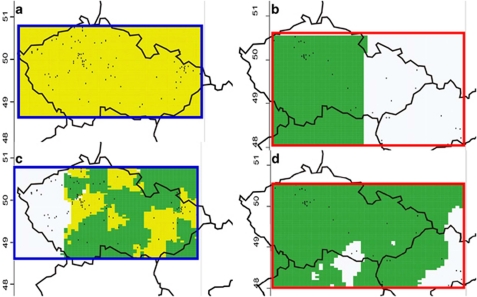
We used the mitochondrial control region and nuclear microsatellites to assess the distribution patterns, population structure, demography and landscape genetics for the hedgehogs Erinaceus europaeus and Erinaceus roumanicus in a transect of the mid-European zone of sympatry. E. roumanicus was less frequent and restricted to regions with lower altitudes. Demographic analyses suggested recent population growth in this species. A comparison of patterns in the spatial variability of mitochondrial and nuclear DNA indicated less sex-biased dispersal and higher levels of gene flow in E. roumanicus. No evidence of recent hybridisation or introgression was detected. We interpreted these results by comparing with phylogeographic and palaeontological studies as well as with the occurrence of hybridisation in the Russian contact zone. We propose that Central Europe was colonised by E. roumanicus by the beginning of the Neolithic period and that there was a subsequent reinforcement stage as well as the formation of a zone of sympatry after the complete reproductive isolation of both species.
Figures
Similar articles
-
Different parasite faunas in sympatric populations of sister hedgehog species in a secondary contact zone.PLoS One. 2014 Dec 3;9(12):e114030. doi: 10.1371/journal.pone.0114030. eCollection 2014. PLoS One. 2014. PMID: 25469872 Free PMC article.
-
Contrasting levels of hybridization across the two contact zones between two hedgehog species revealed by genome-wide SNP data.Heredity (Edinb). 2022 Nov;129(5):305-315. doi: 10.1038/s41437-022-00567-5. Epub 2022 Oct 13. Heredity (Edinb). 2022. PMID: 36229647 Free PMC article.
-
[The first genetic evidence of hybridization between west European and northern white-breasted hedgehogs (Erinaceus europaeus and E. roumanicus) in Moscow Region].Izv Akad Nauk Ser Biol. 2009 Nov-Dec;(6):760-5. Izv Akad Nauk Ser Biol. 2009. PMID: 20143638 Russian.
-
Isolation and characterization of six polymorphic microsatellite loci in the European hedgehog Erinaceus europaeus.Mol Ecol. 1997 Jan;6(1):89-90. doi: 10.1046/j.1365-294x.1997.00159.x. Mol Ecol. 1997. PMID: 9004520 No abstract available.
-
Understanding the phylogeographic patterns of European hedgehogs, Erinaceus concolor and E. europaeus using the MHC.Heredity (Edinb). 2005 Jul;95(1):84-90. doi: 10.1038/sj.hdy.6800694. Heredity (Edinb). 2005. PMID: 16077505
Cited by
-
Genetic structure of the European hedgehog (Erinaceus europaeus) in Denmark.PLoS One. 2020 Jan 17;15(1):e0227205. doi: 10.1371/journal.pone.0227205. eCollection 2020. PLoS One. 2020. PMID: 31951621 Free PMC article.
-
Different parasite faunas in sympatric populations of sister hedgehog species in a secondary contact zone.PLoS One. 2014 Dec 3;9(12):e114030. doi: 10.1371/journal.pone.0114030. eCollection 2014. PLoS One. 2014. PMID: 25469872 Free PMC article.
-
3D Geometric Morphometrics Reveals Convergent Character Displacement in the Central European Contact Zone between Two Species of Hedgehogs (Genus Erinaceus).Animals (Basel). 2020 Oct 4;10(10):1803. doi: 10.3390/ani10101803. Animals (Basel). 2020. PMID: 33020407 Free PMC article.
-
Ectoparasite loads in sympatric urban populations of the northern white-breasted and the European hedgehog.Parasitol Res. 2015 Jun;114(6):2317-23. doi: 10.1007/s00436-015-4427-x. Epub 2015 Mar 29. Parasitol Res. 2015. PMID: 25820646 Free PMC article.
-
Application of a SSR-GBS marker system on investigation of European Hedgehog species and their hybrid zone dynamics.Ecol Evol. 2019 Feb 14;9(5):2814-2832. doi: 10.1002/ece3.4960. eCollection 2019 Mar. Ecol Evol. 2019. PMID: 30891219 Free PMC article.
References
-
- Aulagnier S, Haffner P, Mitchell-Jones AJ, Moutou F, Zima J. Mammals of Europe, North Africa and the Middle East. A&C Black Publisher Ltd: London; 2009.
-
- Avise JC, Arnold J, Baal RM. Intraspecific phylogeography: the mitochondrial DNA bridge between population genetics and systematics. Ann Rev Ecol Syst. 1987;18:489–522.
-
- Bandelt HJ, Foster P, Rohl A. Median-joining networks for inferring intraspecific phylogenies. Mol Biol Evol. 1999;16:37–48. - PubMed
-
- Becher SA, Griffiths R. Isolation and characterization of six polymorphic microsatellite loci in the European hedgehog Erinaceus europaeus. Mol Ecol. 1997;6:89–90. - PubMed
Publication types
MeSH terms
Substances
LinkOut - more resources
Full Text Sources
