. 2012 Mar;46(3):497-504.
doi: 10.1007/s12031-011-9628-x. Epub 2011 Aug 24.

Quantification of gene expression after painful nerve injury: validation of optimal reference genes

Affiliations

Quantification of gene expression after painful nerve injury: validation of optimal reference genes

Madhavi Latha Yadav Bangaru et al. J Mol Neurosci. 2012 Mar.

Abstract

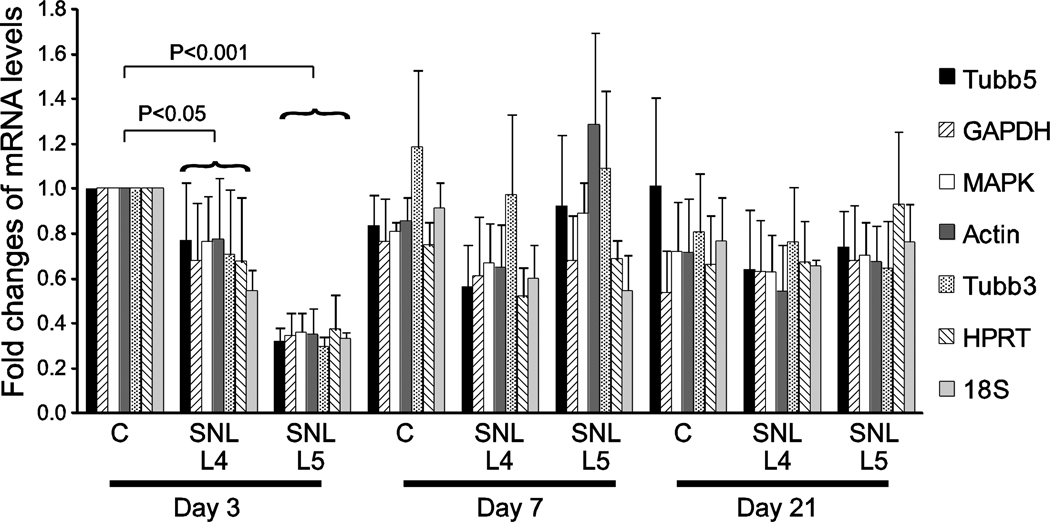
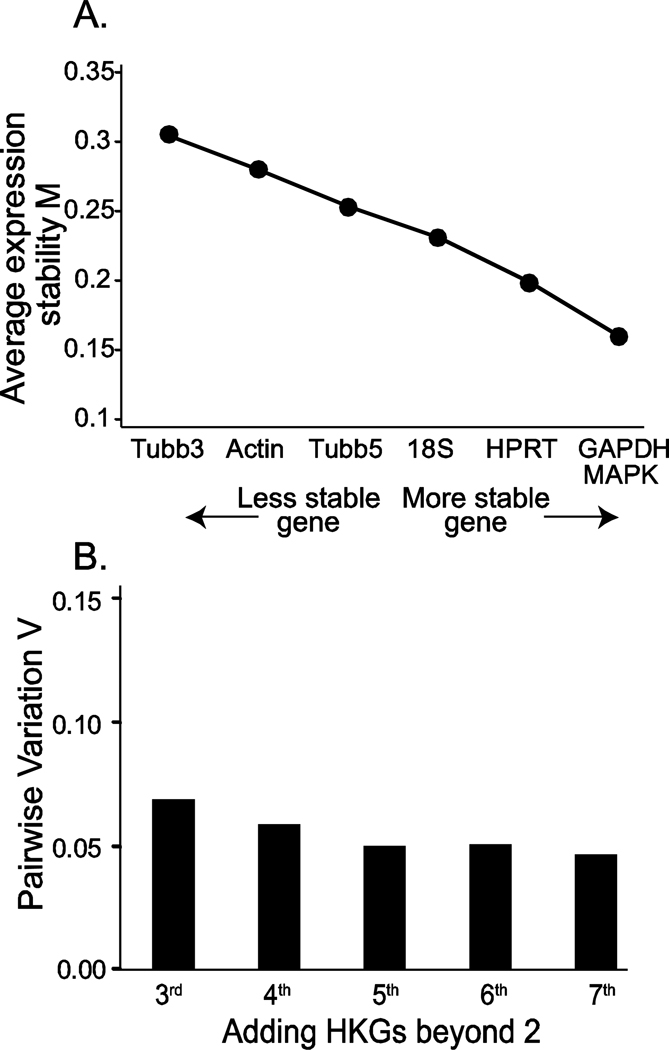
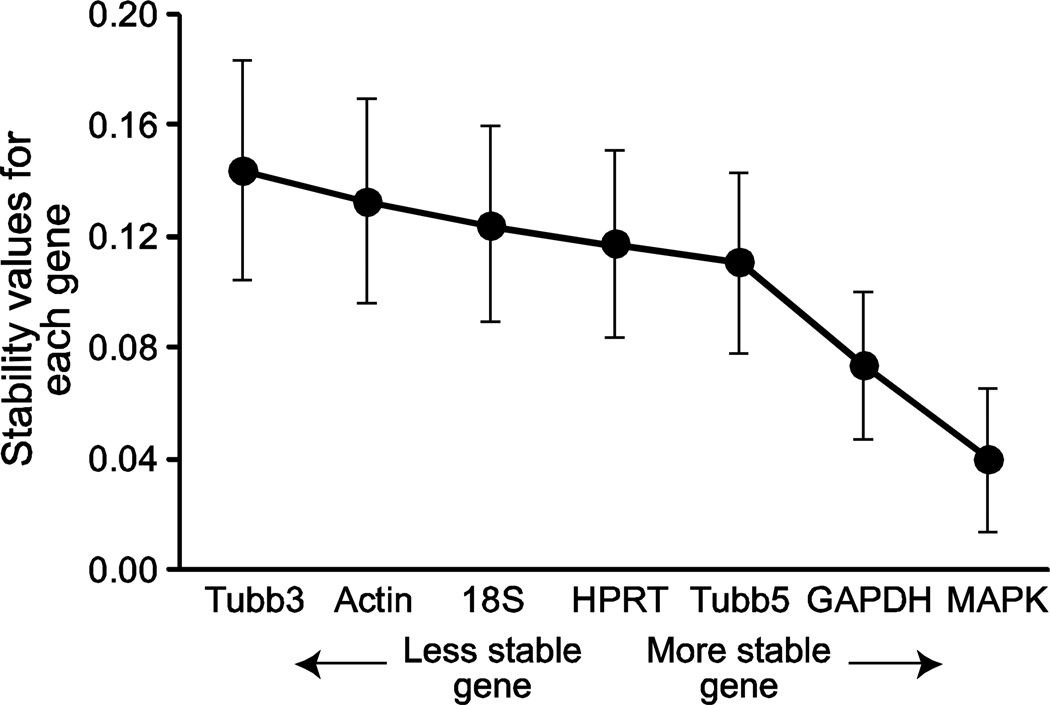
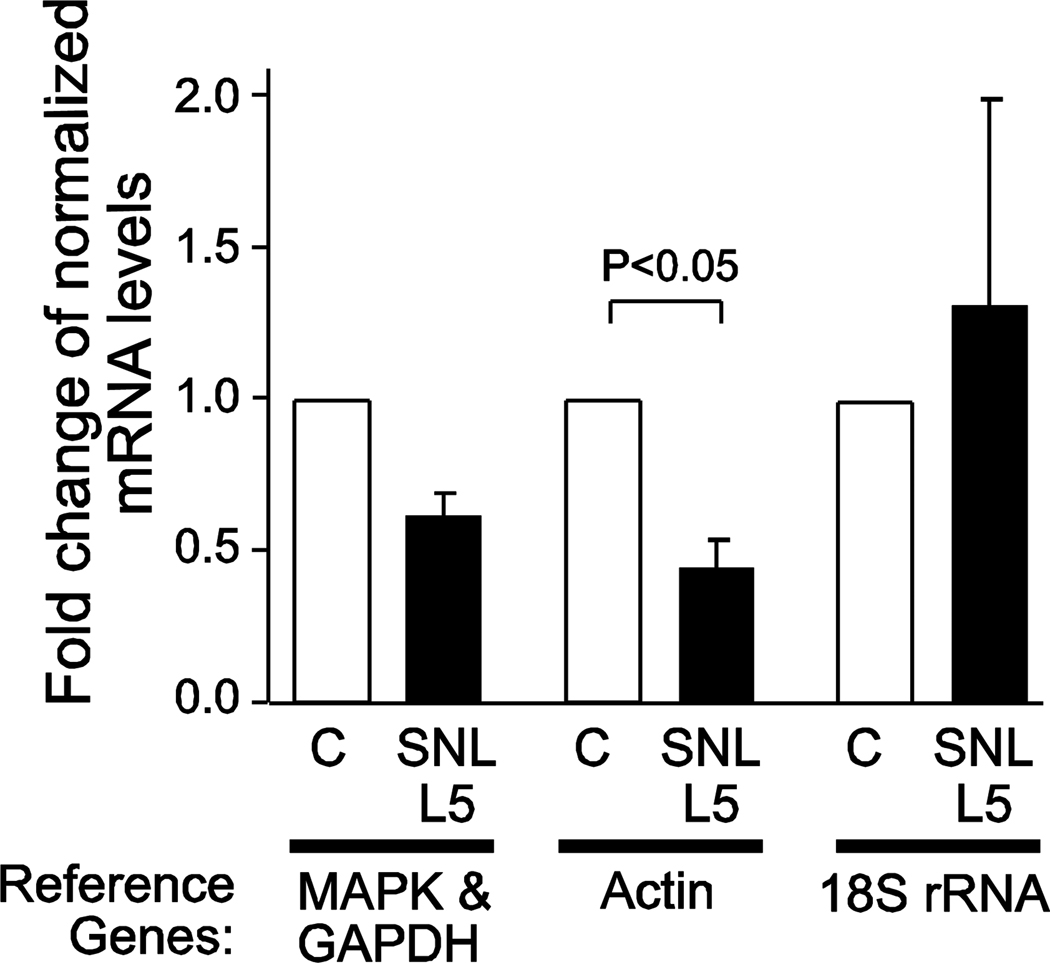
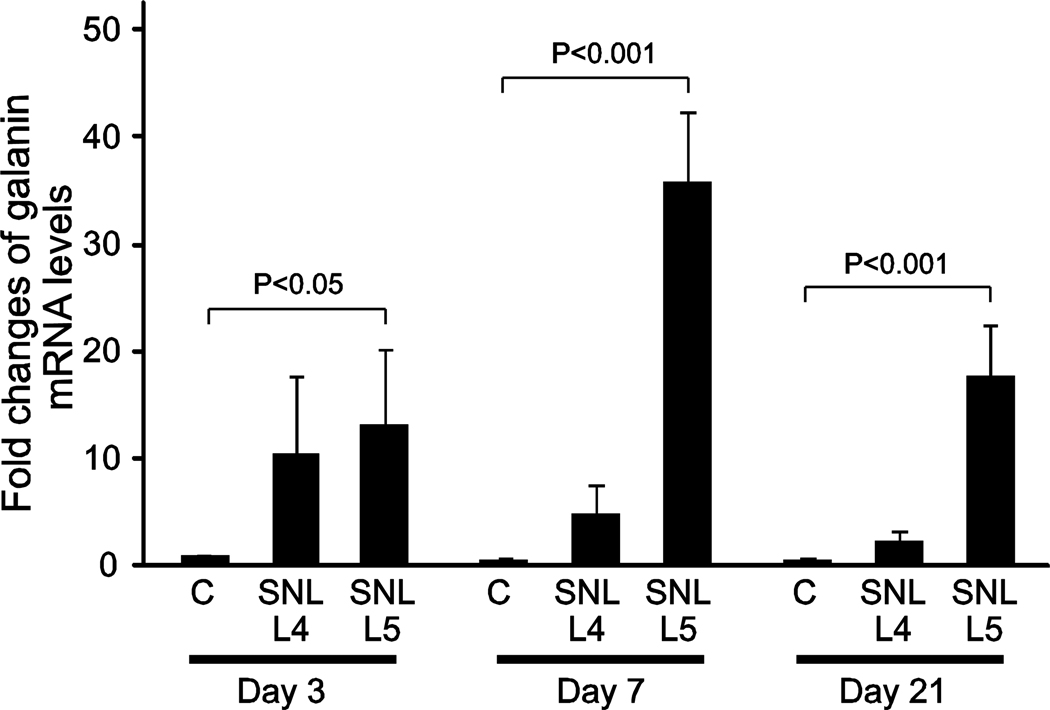
Stably expressed housekeeping genes (HKGs) are necessary for standardization of transcript measurement by quantitative real-time polymerase chain reaction (qRT-PCR). Peripheral nerve injury disrupts expression of numerous genes in sensory neurons, but the stability of conventional HKGs has not been tested in this context. We examined the stability of candidate HKGs during nerve injury, including the commonly used 18S ribosomal RNA, β-tubulin I and β-tubulin III, actin, glyceraldehyde 3-phosphate dehydrogenase (GAPDH) and hypoxanthine phosphoribosyltransferase 1 (HPRT1), and mitogen-activated protein kinase 6 (MAPK6). Total RNA for cDNA synthesis was isolated from dorsal root ganglia of rats at 3, 7, and 21 days following either skin incision alone or spinal nerve ligation, after which the axotomized and adjacent ganglia were analyzed separately. Relative stability of HKGs was determined using statistical algorithms geNorm and NormFinder. Both analyses identified MAPK6 and GAPDH as the two most stable HKGs for normalizing gene expression for qRT-PCR analysis in the context of peripheral nerve injury. Our findings indicate that a prior analysis of HKG expression levels is important for accurate normalization of gene expression in models of nerve injury.


Conflict of interest statement

Competing Interests: The authors claim no conflict of interest.

Figures

Figure 1
Figure 1
Transcript levels of 7 HKGs in DRG at 3, 7 and 21 days after injury. The amount of transcript expression of each gene in each sample is calculated using the comparative CT method. Fold differences of transcript levels in 3, 7 and 21-day control and post-injury samples are calculated by comparison to day 3 controls. The data represent mean ± SEM. The brackets represent significant differences in the expression of all the HKGs taken together for each sample compared to the same day controls. The samples include Control (C), the 4th lumbar dorsal root ganglion after 5th lumbar spinal nerve ligation (SNL L4), and the axotomized 5th lumbar dorsal root ganglion after SNL (SNL L5), at 3, 7 and 21 days after SNL.
Figure 2
Figure 2
A. Determination of stable and required number of HKGs with geNorm software. The stability value M was determined from the data for all the 7 HKGs presented in Figure 1 using geNorm and are plotted in sequence from the most stable (low M value) on the right to the least stable on the left. B. The pairwise variation value (V) for incremental addition of genes shows that the threshold level for sufficiency (V < 0.15) is achieved with the minimum two HKGs.
Figure 3
Figure 3
NormFinder analysis for identifying the most stable HKGs, showing the 7 HKGs in the sequence of their stability.
Figure 4
Figure 4
Stromal interaction molecule-1 (STIM1) gene expression after injury. The tissue samples analyzed for STIM1 expression included skin incision control (C), the 4th lumbar dorsal root ganglion after 5th lumbar spinal nerve ligation (SNL L4), and the axotomized 5th lumbar dorsal root ganglion after SNL (SNL L5), at 3, 7 and 21 days after surgery. Expression of STIM1 was calculated using the comparative CT method following qRT-PCR. Fold differences of transcript levels in 3, 7 and 21-day control and post-injury samples were calculated by comparison to day 3 controls after normalization with the two most stable reference genes, MAPK6 and GAPDH. The data is shown as mean ± SEM. No significant differences were identified between groups using 2-way ANOVA.
Figure 5
Figure 5
Effect of reference genes on Stromal interaction molecule-1 (STIM1) gene expression. The expression level of STIM1 was measured at day 7, and the fold difference was calculated between injured versus control DRG using various normalizing genes. The data represent mean ± SEM. Brackets represent significant differences by Mann-Whitney U test.
Figure 6
Figure 6
Gene expression of galanin following injury to the DRG. The tissue samples analyzed for galanin expression included skin incision control (C), the 4th lumbar dorsal root ganglion after 5th lumbar spinal nerve ligation (SNL L4), and the axotomized 5th lumbar dorsal root ganglion after SNL (SNL L5), at 3, 7 and 21 days after surgery. Galanin expression was calculated using the comparative CT method following qRT-PCR. Fold differences of transcript levels in 3, 7 and 21 control and post-injury samples were calculated by comparison to day 3 controls. Data are shown as mean ± SEM. Statistical analysis was performed by 2-way ANOVA. Brackets indicate significant paired comparisons to control groups for each day (Bonferroni’s correction).

Similar articles

Cited by

References

    1. Andersen CL, Jensen JL, Orntoft TF. Normalization of real-time quantitative reverse transcription-PCR data: a model-based variance estimation approach to identify genes suited for normalization, applied to bladder and colon cancer data sets. Cancer Res. 2004;64(15):5245–5250. - PubMed
    1. Boeshore KL, Schreiber RC, Vaccariello SA, Sachs HH, Salazar R, Lee J, Ratan RR, Leahy P, Zigmond RE. Novel changes in gene expression following axotomy of a sympathetic ganglion: a microarray analysis. J Neurobiol. 2004;59(2):216–235. - PubMed
    1. Bonefeld BE, Elfving B, Wegener G. Reference genes for normalization: a study of rat brain tissue. Synapse. 2008;62(4):302–309. - PubMed
    1. Cai JH, Deng S, Kumpf SW, Lee PA, Zagouras P, Ryan A, Gallagher DS. Validation of rat reference genes for improved quantitative gene expression analysis using low density arrays. Biotechniques. 2007;42(4):503–512. - PubMed
    1. Costigan M, Befort K, Karchewski L, Griffin RS, D'Urso D, Allchorne A, Sitarski J, Mannion JW, Pratt RE, Woolf CJ. Replicate high-density rat genome oligonucleotide microarrays reveal hundreds of regulated genes in the dorsal root ganglion after peripheral nerve injury. BMC Neurosci. 2002;3:16. - PMC - PubMed

Publication types