. 2011 Oct 1;51(19):2132-8.
doi: 10.1016/j.visres.2011.08.008. Epub 2011 Aug 16.

The relationship between peripapillary crescent and axial length: Implications for differential eye growth

Affiliations

The relationship between peripapillary crescent and axial length: Implications for differential eye growth

Toco Y P Chui et al. Vision Res. .

Abstract

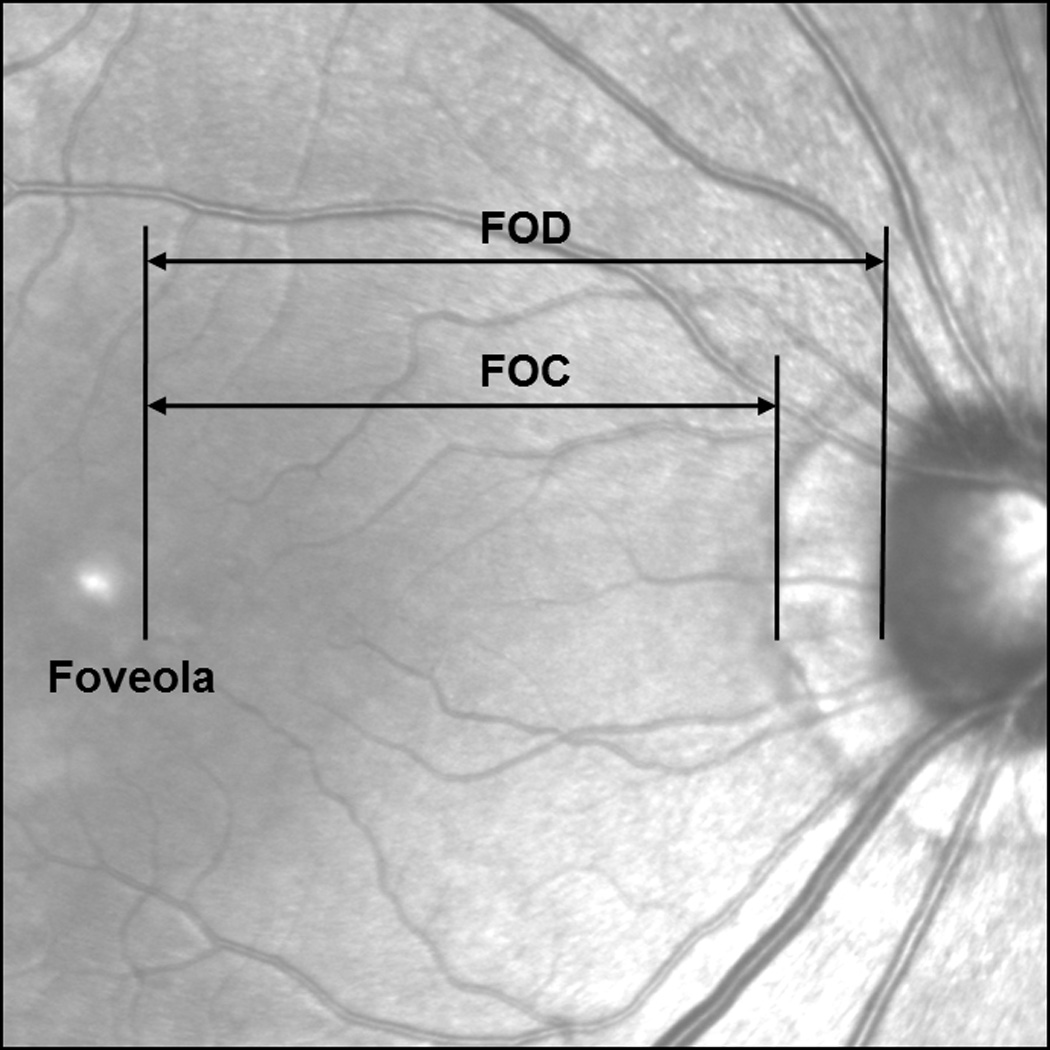
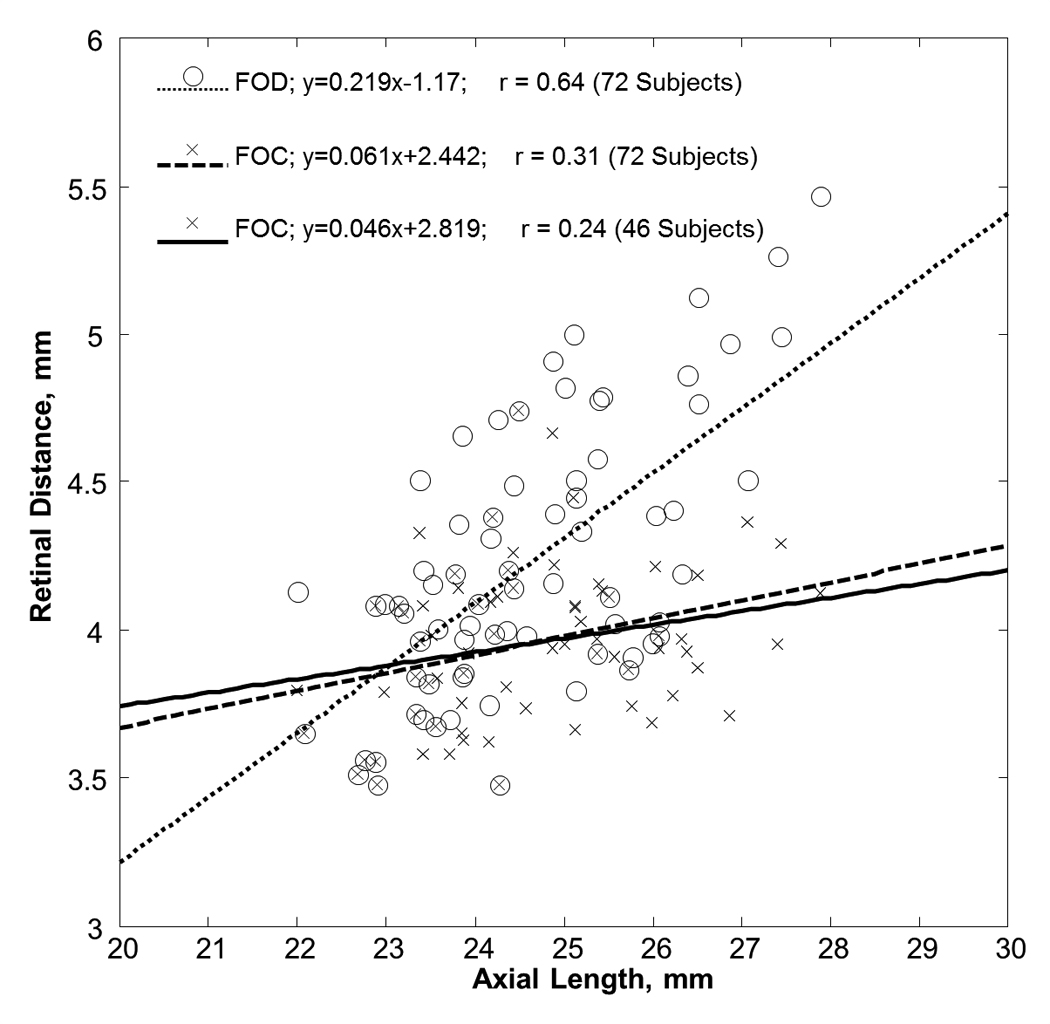
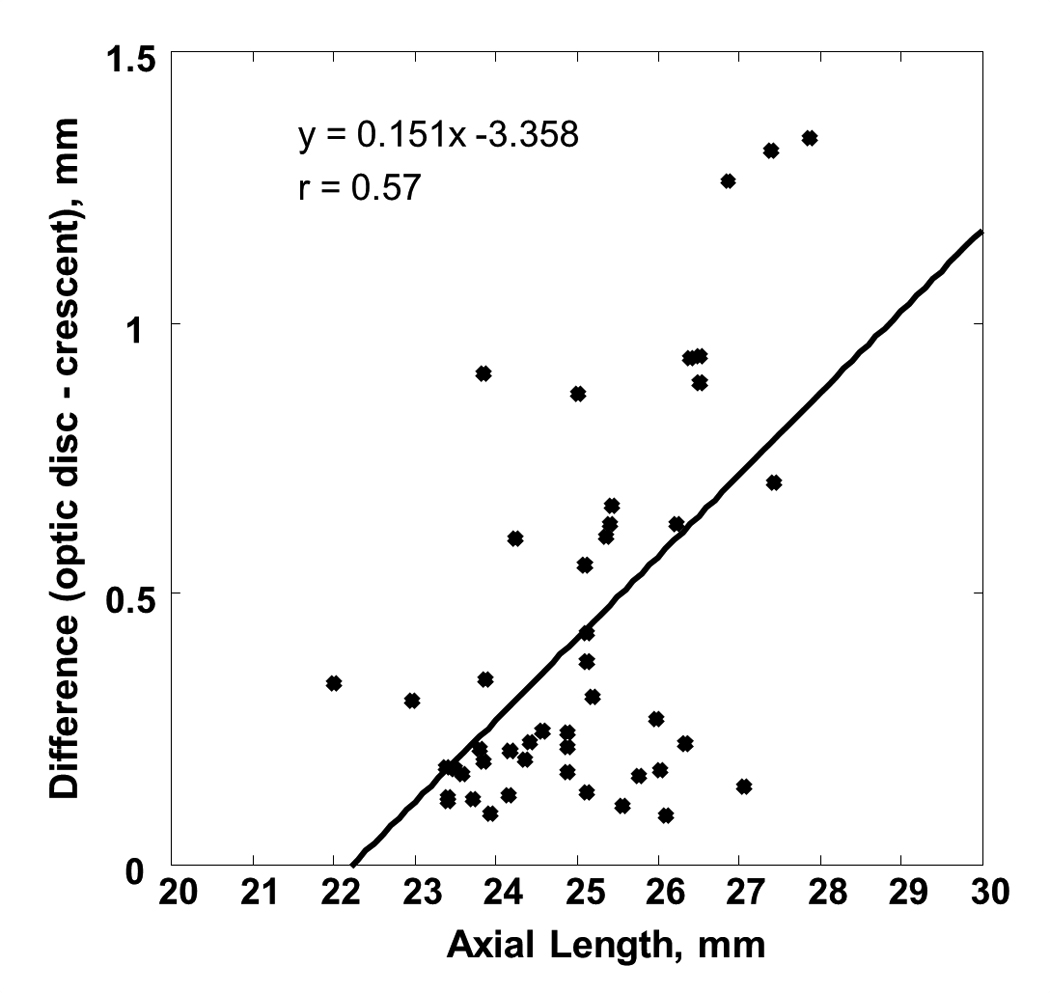
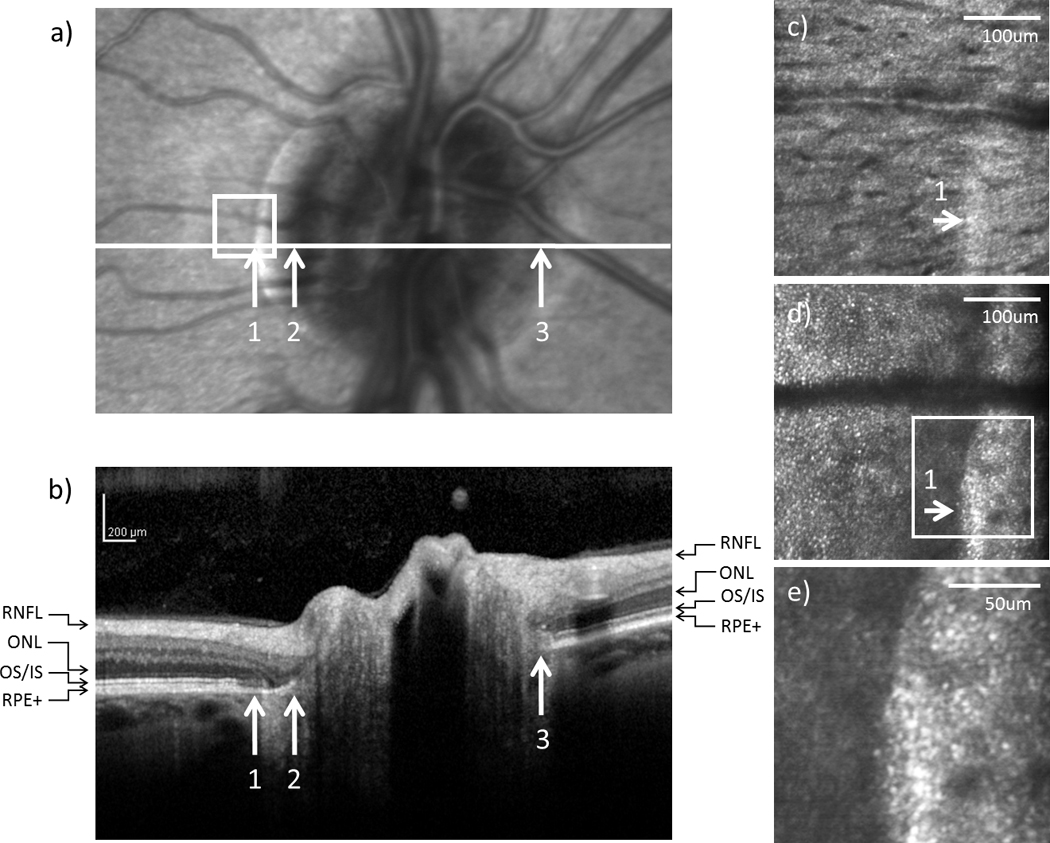
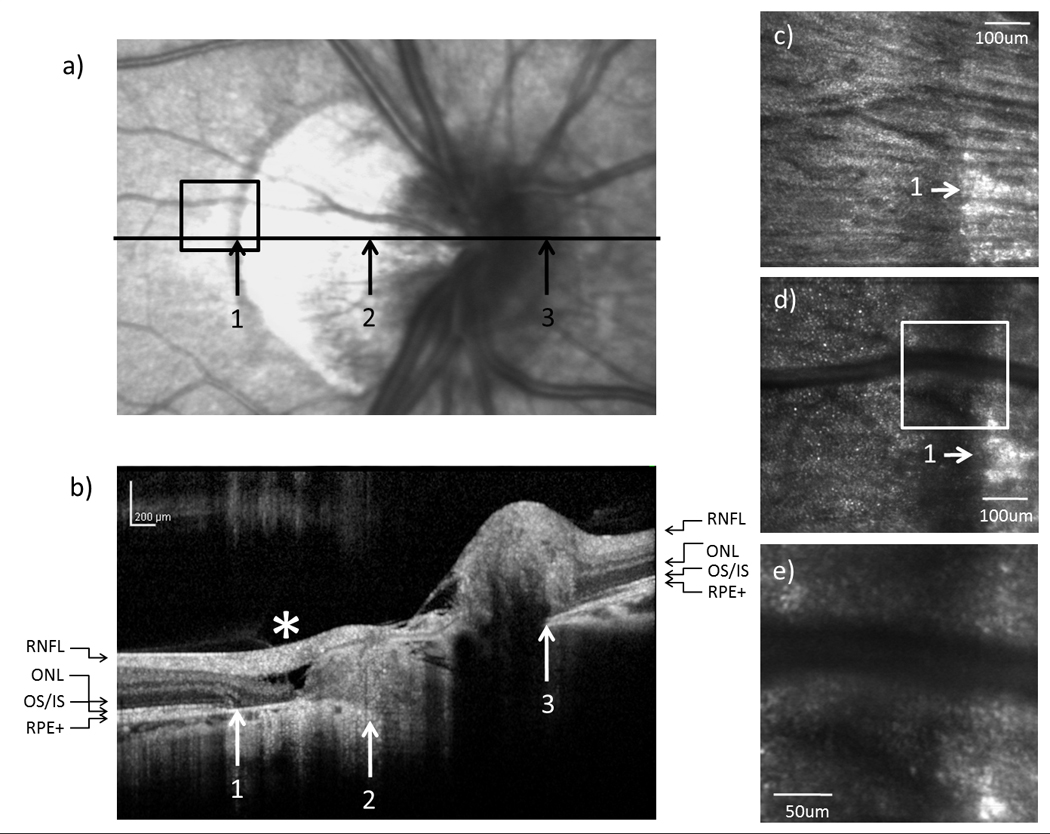
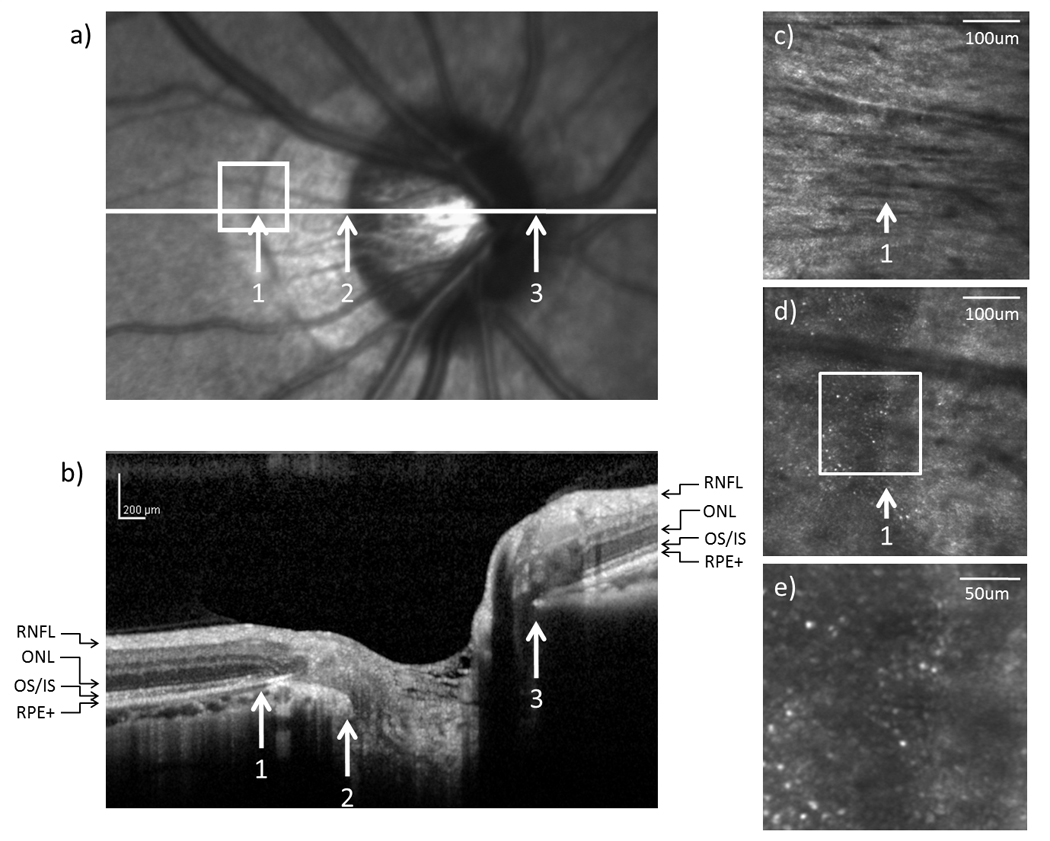
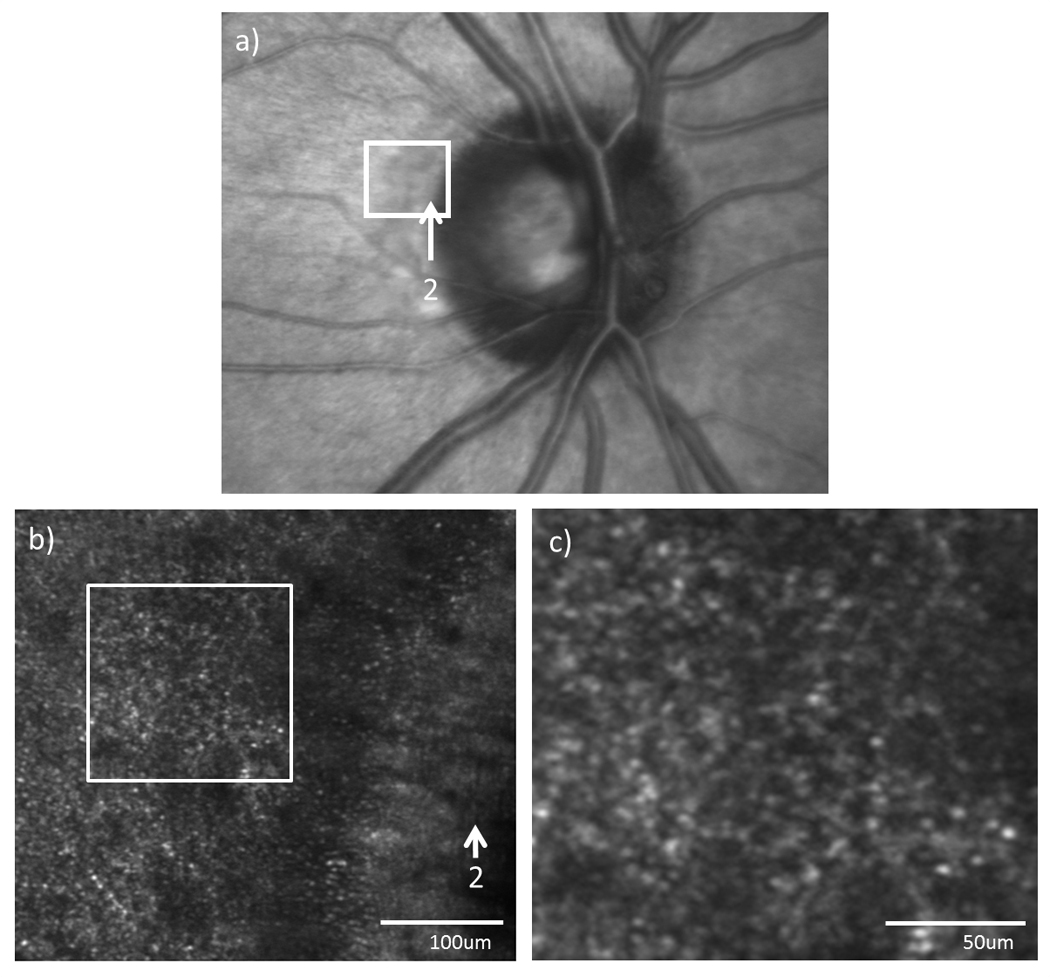
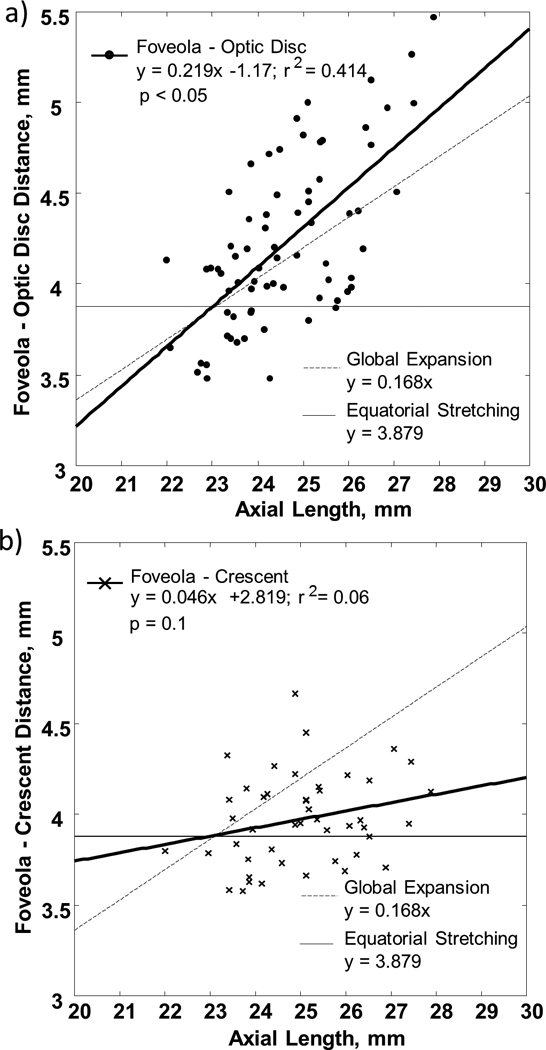
We evaluated the relationship between the size of the peripapillary crescent and the axial length (AL) of the eye as well as the fine structure of the peripapillary crescent in selected eyes. Infrared fundus imaging and spectral domain optical coherence tomography (SDOCT) (Spectralis HRA+OCT, Heidelberg Engineering, Germany) centered at the fovea were performed on 72 healthy adults. On the infrared fundus images, we measured (a) the distance between the foveola and the temporal edge of the optic disc (FOD) and (b) the distance between the foveola and the temporal edge of the peripapillary crescent (FOC) (if present). A peripapillary crescent presented at the nasal margin of the disc in 64% of the subjects. The FOD and FOC were 4.22mm±0.46 and 3.97mm±0.25, respectively. Only the FOD was significantly correlated with axial length. As AL increased by 10%, the FOD increased by 13%, the outer neural retina only expanded by 4% (as indicated by the FOC). This result emphasizes that retinal stretching may not mirror scleral growth, and the existence in some eyes of a difference between the photoreceptor margin and retinal pigment epithelium (RPE) margin suggests that within the retina there could be slippage during eye growth.


Figures

Figure 1
Figure 1
Retinal distances measured on the infrared fundus image. Both FOD and FOC were measured along the horizontal axis from the foveola to the optic disc margin or the crescent margin.
Figure 2
Figure 2
Variation of retinal distance with axial length. Open symbols represent the retinal distance from the foveola to the temporal edge of the optic disc (FOD). Cross symbols represent the retinal distance from the foveola to the temporal edge of the crescent (FOC). The dotted and dashed lines represent the linear regression fit of the FOD and FOC in 72 subjects, respectively. The solid line represents the linear regression fit of the FOC in 46 subjects who had optic disc crescent.
Figure 3
Figure 3
The difference of FOD and FOC as a function of axial length. Optic disc crescent presents in 64% of the subjects with an average of 0.42mm in width. Linear regression to the data is showed by the solid line.
Figure 4
Figure 4
(a) Infrared and (b) SDOCT images of the optic disc in subject 1. Arrows indicate (1) the temporal edge of the crescent, (2) the temporal edge of the optic disc, and (3) the nasal edge of the optic disc. The SDOCT scan across the optic disc as indicated by the white horizontal line in (a) is shown in (b) (RNFL = retinal nerve fiber layer; ONL = outer nuclear layer; OS/IS = junction of outer segment and outer segment of photoreceptors; RPE+ = retinal pigment epithelium complex). High resolution AOSLO images of (c) RNFL and (d) cone photoreceptor on the temporal edge of the crescent as indicated by the white box on (a), arrows indicate the edge of the crescent. (e) Magnified view of the crescent as indicated by the white box on (d).
Figure 5
Figure 5
(a) Infrared and (b) SDOCT images of the optic disc in subject 3. High resolution AOSLO images of (c) RNFL and (d) cone photoreceptor on the temporal edge of the crescent as indicated by the black box on (a). (e) Magnified view of the crescent as indicated by the white box on (d). * indicates retinal slippage.
Figure 6
Figure 6
(a) Infrared and (b) SDOCT images of the optic disc in subject 5. High resolution AOSLO images of (c) RNFL and (d) cone photoreceptor on the temporal edge of the crescent as indicated by the white box on (a). (e) Magnified view of the crescent as indicated by the white box on (d).
Figure 7
Figure 7
(a) Infrared fundus image and (b) high resolution AOSLO images of the optic disc edge in subject 4. Arrows indicate the temporal edge of the optic disc. (c) Magnified view of the AOSLO image as indicated by the white box on (b).
Figure 8
Figure 8
a) FOD and b) FOC as a function of axial length. Linear regressions to the data are showed by the heavy solid lines. The light solid lines indicate the prediction of FOD and FOC by the equatorial stretching model. The dashed lines indicate the prediction of FOD and FOC by the global expansion model.

References

    1. Bennett AG, Rudnicka AR, Edgar DF. Improvements on Littmann's method of determining the size of retinal features by fundus photography. Graefes Arch Clin Exp Ophthalmol. 1994;232(6):361–367. - PubMed
    1. Burns SA, Wu S, Delori F, Elsner AE. Direct measurement of human-cone-photoreceptor alignment. J Opt Soc Am A Opt Image Sci Vis. 1995;12(10):2329–2338. - PubMed
    1. Burns SA, Zhong Z, Qi X, Elsner AE. Multi-wavelength imaging and image quality for a dual deformable adaptive optics SLO. Invest Ophthalmol Vis Sci. 2010;51 E-Abstract 3454.
    1. Carbonelli M, Savini G, Zanini M, Barboni P. Peripapillary detachment in pathologic myopia: Unusual OCT findings. Clin Ophthalmol. 2007;1(3):327–329. - PMC - PubMed
    1. Chui TY, Song H, Burns SA. Adaptive-optics imaging of human cone photoreceptor distribution. J Opt Soc Am A Opt Image Sci Vis. 2008a;25(12):3021–3029. - PMC - PubMed

Publication types