. 2011 Oct 14;286(41):36011-36019.
doi: 10.1074/jbc.M111.265082. Epub 2011 Aug 24.

Vav protein guanine nucleotide exchange factor regulates CD36 protein-mediated macrophage foam cell formation via calcium and dynamin-dependent processes

Affiliations

Vav protein guanine nucleotide exchange factor regulates CD36 protein-mediated macrophage foam cell formation via calcium and dynamin-dependent processes

S Ohidar Rahaman et al. J Biol Chem. .

Abstract

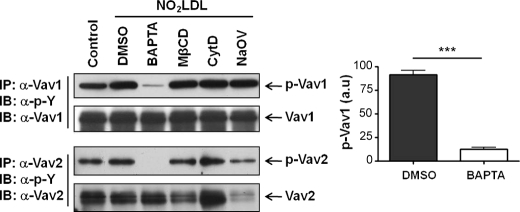
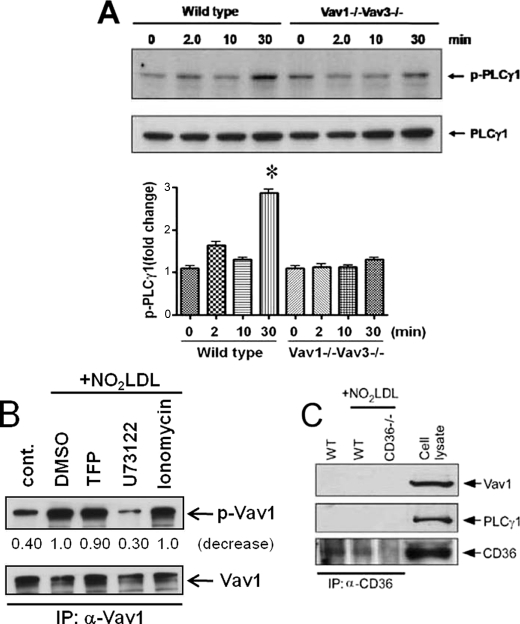
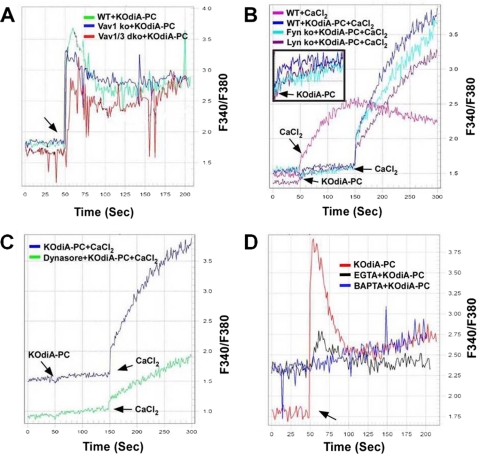
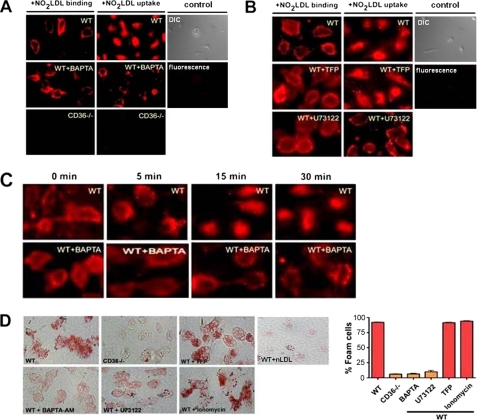
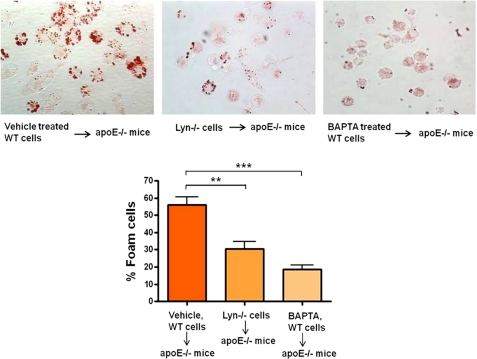
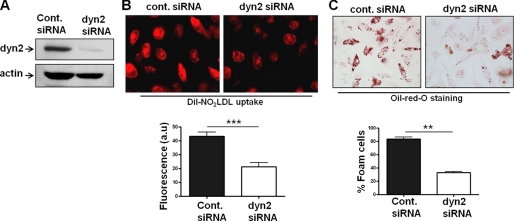
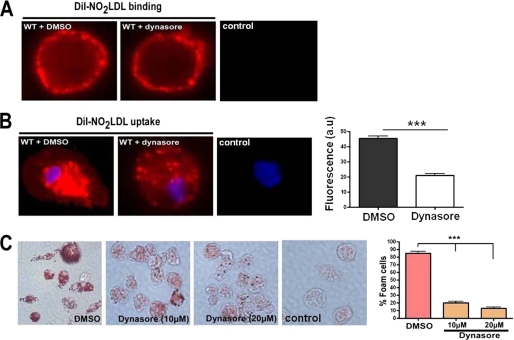
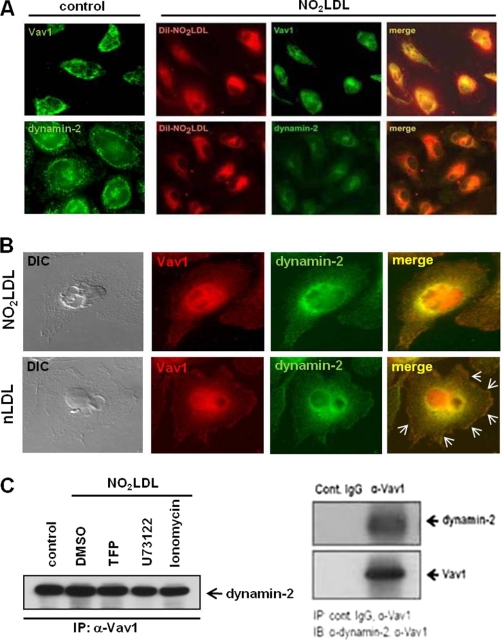
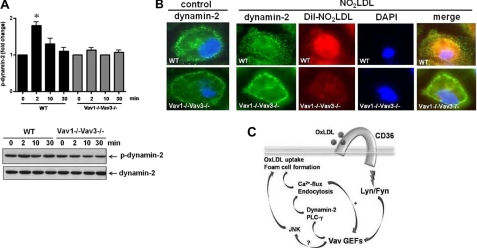
Atherosclerosis, a chronic inflammatory disease, results in part from the accumulation of modified lipoproteins in the arterial wall and formation of lipid-laden macrophages, known as "foam cells." Recently, we reported that CD36, a scavenger receptor, contributes to activation of Vav-family guanine nucleotide exchange factors by oxidatively modified LDL in macrophages. We also discovered that CD36-dependent uptake of oxidized LDL (oxLDL) in vitro and foam cell formation in vitro and in vivo was significantly reduced in macrophages deficient of Vav proteins. The goal of the present study was to identify the mechanisms by which Vav proteins regulate CD36-dependent foam cell formation. We now show that a Vav-dynamin signaling axis plays a critical role in generating calcium signals in mouse macrophages exposed to CD36-specific oxidized phospholipid ligands. Chelation of intracellular Ca(2+) or inhibition of phospholipase C-γ (PLC-γ) inhibited Vav activation (85 and 70%, respectively, compared with vehicle control) and reduced foam cell formation (approximately 75%). Knockdown of expression by siRNA or inhibition of GTPase activity of dynamin 2, a Vav-interacting protein involved in endocytic vesicle fission, significantly blocked oxLDL uptake and inhibited foam cell formation. Immunofluorescence microscopy studies showed that Vav1 and dynamin 2 colocalized with internalized oxLDL in macrophages and that activation and mobilization of dynamin 2 by oxLDL was impaired in vav null cells. These studies identified previously unknown components of the CD36 signaling pathway, demonstrating that Vav proteins regulate oxLDL uptake and foam cell formation via calcium- and dynamin 2-dependent processes and thus represent novel therapeutic targets for atherosclerosis.


Figures

FIGURE 1.
FIGURE 1.
Intracellular calcium regulates oxLDL-induced activation of Vav proteins in macrophages. MPM pretreated with vehicle (DMSO), BAPTA/AM (5 μm), methyl-β-cyclodextrin (MβCD) (5 mm), cytochalasin-D (CytD) (20 μm), or sodium orthovanadate (NaOV) (20 μm) were exposed to NO2LDL (50 μg/ml) and Vav activation status detected by IP followed by IB analysis. Cells without NO2LDL treatment were used as control. In brief, whole cell extracts were subjected to IP with antibodies to the two specific Vav family members. Precipitates were then subjected to IB analysis with anti-phospho-tyrosine, and the blots were then stripped and reprobed with antibodies to the individual Vavs to assess total protein loaded. The bar graphs of mean ± S.E. from three separate experiments show an 85% decrease in Vav1 phosphorylation in the presence of BAPTA. ***, p < 0.0001, Student's t test. DMSO, dimethyl sulfoxide.
FIGURE 2.
FIGURE 2.
PLCγ1 regulates oxLDL-induced activation of Vav proteins in macrophages. A, IB of extracts from WT and vav1;vav3 double-null MPM exposed to NO2LDL for timed points using antibodies to PLC-γ1 and p-PLC-γ1 shows impaired phosphorylation in vav null cells compared with the WT. The bar graphs show mean ± S.E. from three separate experiments. *, p < 0.05, Student's t test. B, MPM pretreated with a PLCγ inhibitor (U73122, 1 μm), calmodulin inhibitor (TFP, 5 μm), or calcium ionophore (ionomycin, 5 μm) were exposed to NO2LDL or untreated and assessed for Vav1 phosphorylation by IP/IB as in Fig. 1. The blot is representative of three separate experiments. C, WT and cd36 null MPM were treated with NO2LDL (50 μg/ml) for 2 min, and CD36 was immunoprecipitated with a monoclonal antibody. IPs were analyzed by IB with antibodies to Vav1, PLCγ1, and CD36. A cell lysate from WT MPM was used as a positive control.
FIGURE 3.
FIGURE 3.
OxPL induce macrophage Ca2+ flux in a Vav-dependent manner. MPM (106 cells/ml) loaded with fura2-AM (4 μm) for 60 min were transferred to a cuvette, and fluorescence emission was recorded continuously at 340 and 380 nm after addition of KOdiA-PC (30 μg/ml). Intracellular Ca2+ was measured as above in WT, vav1 null, and vav1;vav3 double-null MPM (A) as well as lyn and fyn null MPM (B). The inset in Fig. 3B shows the basal level of Ca2+ flux generation in various cell types by KOdiA-PC in the absence of any external calcium. C, intracellular Ca2+ flux in MPM treated with dimethyl sulfoxide (DMSO) or the dynamin GTPase inhibitor dynasore (20 μm) for 30 min before stimulation with KOdiA-PC. In B and C, we compared calcium flux generation by KOdiA-PC because of influx of external calcium from added CaCl2 (arrows). D, MPM pretreated with EGTA (2 mm) or BAPTA (10 μm) for 30 min were stimulated with KOdiA-PC (30 μg/ml) and intracellular Ca2+ measured as above. The arrow indicates the time of KOdiA-PC addition. Representative data from three experiments is shown.
FIGURE 4.
FIGURE 4.
CD36-mediated oxLDL uptake and foam cell formation are calcium-dependent. A and B, MPM were pretreated with an intracellular calcium chelator (BAPTA/AM, 5 μm), PLCγ inhibitor (U73122, 1 μm), calmodulin inhibitor (TFP, 5 μm), or vehicle control for 30–60 min and then exposed to DiI-NO2LDL (5 μg/ml) for 30 min at either 4 °C or 37 °C. Cells were examined by fluorescence microscopy to detect binding (4 °C) or uptake (37 °C). cd36 null cells and WT cells not treated with DiI-NO2LDL were used as a control. Differential interference contrast (DIC) and fluorescence images from WT control cells are shown. C, vehicle or BAPTA pretreated MPM were exposed to DiI-labeled NO2LDL for 30 min at 4 °C to allow binding and then transferred to 37 °C to examine internalization at 0-, 5-, 15-, and 30-min intervals. D, MPM from WT or cd36 null mice were treated with inhibitors as in A and B and then incubated for 8 h with 50 μg/ml of NO2LDL. Cells were then fixed, stained with Oil-Red-O, and analyzed microscopically to quantify foam cell formation. WT cells exposed to native LDL are shown as control. The bar graphs show mean ± S.E. from four randomly chosen fields from each group.
FIGURE 5.
FIGURE 5.
In vivo foam cell formation is dependent on calcium flux and Src kinase Lyn. BAPTA/AM- (5 μm) or dimethyl sulfoxide (DMSO)-pretreated WT cells and lyn null cells were injected intraperitoneally into apoe null recipient mice (n = 3 for each group) that had been maintained on a Western diet for 6 weeks. After 72 h, cells were recovered from the recipient mice and stained with Oil-Red-O to quantify foam cell formation. The bar graphs show mean ± S.E. from five randomly chosen fields from each group. **, p < 0.005; ***, p < 0.0002, Student's t test.
FIGURE 6.
FIGURE 6.
CD36-mediated oxLDL uptake and foam cell formation are dependent on dynamin 2. A, BMDM were transfected with control scramble or dynamin 2 siRNA duplex oligonucleotides for 72 h. Cell lysates obtained from siRNA-treated cells were immunoblotted with antibodies to dynamin 2 and actin to determine the knockdown efficacy and specificity. B, BMDM were transfected with control-siRNA or dyn2-siRNA for 72 h, and then DiI-NO2LDL uptake was visualized as in Fig. 4A. The bar graph shows mean cellular fluorescence. For quantitation we measured the fluorescence intensity of 7–9 randomly selected cells from each group by ImageJ software. ***, p < 0.0001, Student's t test. C, BMDM were transfected as above prior to incubation for 15 h with 50 μg/ml NO2LDL. Cells were then fixed and stained with Oil-Red-O to quantify foam cell formation. The bar graphs show the mean ± S.E. from four randomly chosen fields from each group. **, p < 0.005, Student's t test.
FIGURE 7.
FIGURE 7.
CD36-mediated oxLDL uptake and foam cell formation are dependent on dynamin GTPase activity. A and B, MPM were pretreated with an inhibitor of dynamin GTPase activity (dynasore, 10 μm) or vehicle for 60 min, and then DiI-NO2LDL binding and uptake were visualized as in Fig. 4A. The bar graph shows mean cellular fluorescence for DiI-NO2LDL uptake. For quantitation we measured fluorescence intensity of five to six randomly selected cells from each group by ImageJ software. ***, p < 0.0001, Student's t test. WT cells not treated with DiI-NO2LDL are shown as a control. C, MPM were pretreated as above prior to incubation for 8 h with 50 μg/ml NO2LDL. Cells were then fixed and stained with Oil-Red-O to quantify foam cell formation. The bar graphs show the mean± S.E. from four randomly chosen fields from each group. ***, p < 0.0001, Student's t test.
FIGURE 8.
FIGURE 8.
Colocalization of Vav1 and dynamin-2 with internalized oxLDL in macrophages. (A) MPM were incubated with DiI-NO2LDL (5 μg/ml) for 30 min at 37 °C then fixed and incubated with monoclonal antibodies to Vav1 or dynamin-2 followed by Alexa 488-conjugated secondary antibody. Representative microscopic images of DiI-NO2LDL (red), Vav1 (green), dynamin-2 (green), and merged (yellow or orange) are shown. B, MPM were incubated with NO2LDL or nLDL (50 μg/ml) for 30 min at 37 °C then fixed and incubated with antibodies to Vav1 or dynamin 2 followed by Alexa Fluor-conjugated secondary antibodies. Representative microscopic images of Vav1 (red), dynamin-2 (green), merged (yellow or orange), and differential interference contrast (DIC) (black and white) are shown. Marked colocalization of Vav1 with dynamin 2 at plasma membrane areas are indicated by arrows in control cells treated with nLDL. C, Vav1 was immunoprecipitated from MPM (with or without NO2LDL exposure) pretreated with dimethyl sulfoxide (DMSO), ionophore, U73122, or TFP (left panel). IPs were analyzed by IB with anti-dynamin 2 antibody. Cell extracts were immunoprecipitated with isotype-matched control IgG or antibody to Vav1 to show specificity of its interaction with dynamin 2 (right panel).
FIGURE 9.
FIGURE 9.
Vav regulates oxLDL-mediated activation and translocation of dynamin 2. A, MPM from WT and vav1;vav3 double-null mice were exposed to NO2LDL (50 μg/ml) for timed points to 30 min. Cell extracts were immunoprecipitated with antibody to dynamin 2, and precipitates were then subjected to immunoblot analysis with anti-p-tyrosine antibody. Blots were stripped and reprobed with antibody to dynamin 2 to assess total protein loaded. Blots were scanned to quantify band densities, and fold-change relative to total protein is indicated as mean ± S.E. n = 3. *, p < 0.05, Student's t test. B, untreated (left panel) and DiI-NO2LDL-exposed (right panel) WT and vav1;vav3 double-null MPM were stained as above with anti-dynamin 2 antibody (green). Nuclei were stained blue with DAPI. Merged images show impaired translocation of dynamin 2 to perinuclear areas in vav1;vav3 double-null cells exposed to NO2LDL (right panel). C, model depicting how oxLDL-CD36 engagement induces a signaling cascade that leads to recruitment and activation of the SFK Lyn, which in turn activates Vavs. Interaction of Vav proteins with PLCγ causes generation of Ca2+ flux, which in turn helps to maintain activation of Vavs, internalization of oxLDL, and formation of foam cells. Vavs also interact with dynamin 2, which plays a critical role in CD36-dependent oxLDL uptake and foam cell formation by regulating generation of Ca2+ flux and trafficking of the oxLDL-containing endosomes.

Similar articles

Cited by

References

    1. Glass C. K., Witztum J. L. (2001) Cell 104, 503–516 - PubMed
    1. Podrez E. A., Febbraio M., Sheibani N., Schmitt D., Silverstein R. L., Hajjar D. P., Cohen P. A., Frazier W. A., Hoff H. F., Hazen S. L. (2000) J. Clin. Invest. 105, 1095–1108 - PMC - PubMed
    1. Podrez E. A., Poliakov E., Shen Z., Zhang R., Deng Y., Sun M., Finton P. J., Shan L., Febbraio M., Hajjar D. P., Silverstein R. L., Hoff H. F., Salomon R. G., Hazen S. L. (2002) J. Biol. Chem. 277, 38517–38523 - PubMed
    1. Zhao Z., de Beer M. C., Cai L., Asmis R., de Beer F. C., de Villiers W. J., van der, Westhuyzen D. R. (2005) Arterioscler. Thromb. Vasc. Biol. 25, 168–173 - PubMed
    1. Febbraio M., Podrez E. A., Smith J. D., Hajjar D. P., Hazen S. L., Hoff H. F., Sharma K., Silverstein R. L. (2000) J. Clin. Invest. 105, 1049–1056 - PMC - PubMed

Publication types

MeSH terms