

How good is the turbid medium-based approach for accounting for light partitioning in contrasted grass--legume intercropping systems?
- PMID: 21865218
- PMCID: PMC3189846
- DOI: 10.1093/aob/mcr199
How good is the turbid medium-based approach for accounting for light partitioning in contrasted grass--legume intercropping systems?
Abstract
Background and aims: Most studies dealing with light partitioning in intercropping systems have used statistical models based on the turbid medium approach, thus assuming homogeneous canopies. However, these models could not be directly validated although spatial heterogeneities could arise in such canopies. The aim of the present study was to assess the ability of the turbid medium approach to accurately estimate light partitioning within grass-legume mixed canopies.
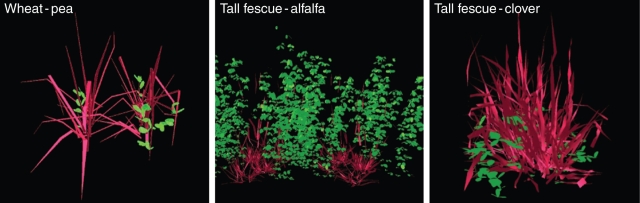
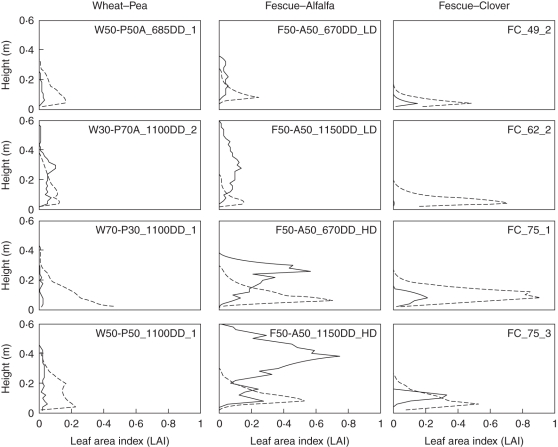
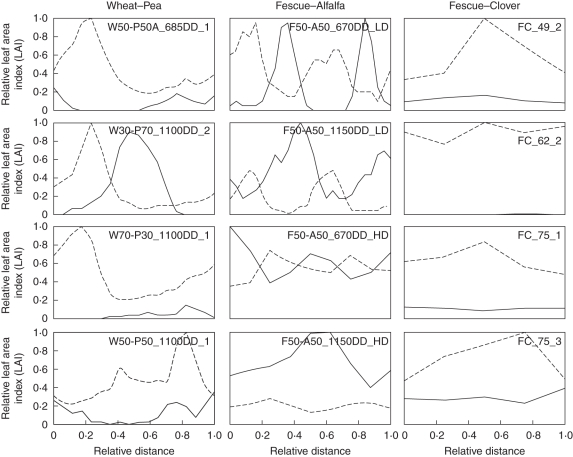
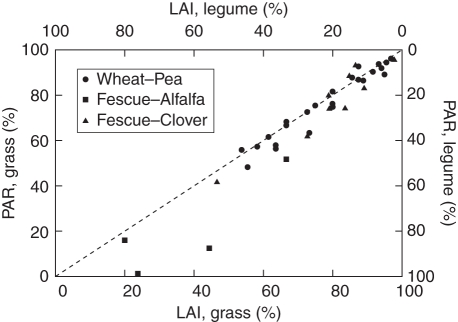
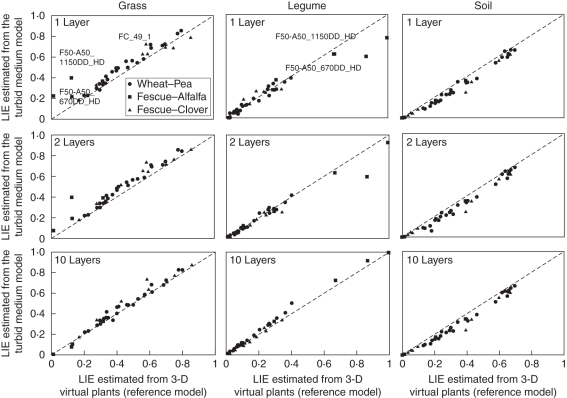
Methods: Three contrasted mixtures of wheat-pea, tall fescue-alfalfa and tall fescue-clover were sown according to various patterns and densities. Three-dimensional plant mock-ups were derived from magnetic digitizations carried out at different stages of development. The benchmarks for light interception efficiency (LIE) estimates were provided by the combination of a light projective model and plant mock-ups, which also provided the inputs of a turbid medium model (SIRASCA), i.e. leaf area index and inclination. SIRASCA was set to gradually account for vertical heterogeneity of the foliage, i.e. the canopy was described as one, two or ten horizontal layers of leaves.
Key results: Mixtures exhibited various and heterogeneous profiles of foliar distribution, leaf inclination and component species height. Nevertheless, most of the LIE was satisfactorily predicted by SIRASCA. Biased estimations were, however, observed for (1) grass species and (2) tall fescue-alfalfa mixtures grown at high density. Most of the discrepancies were due to vertical heterogeneities and were corrected by increasing the vertical description of canopies although, in practice, this would require time-consuming measurements.
Conclusions: The turbid medium analogy could be successfully used in a wide range of canopies. However, a more detailed description of the canopy is required for mixtures exhibiting vertical stratifications and inter-/intra-species foliage overlapping. Architectural models remain a relevant tool for studying light partitioning in intercropping systems that exhibit strong vertical heterogeneities. Moreover, these models offer the possibility to integrate the effects of microclimate variations on plant growth.
Figures
References
-
- Adam B, Sinoquet H, Godin C, Donès N. 3A – software for the acquisition of plant architecture. Clermont-Ferrand: UMR PIAF INRA-UBP; 1999.
-
- Adam B, Donès N, Sinoquet H. VegeSTAR – software to compute light interception and canopy photosynthesis from images of 3D digitised plants. Clermont-Ferrand: UMR PIAF INRA-UBP; 2002.
-
- Andrieu B, Sinoquet H. Evaluation of structure description requirements for predicting gap fraction of vegetation canopies. Agricultural and Forest Meteorology. 1993;65:207–227.
-
- Awal MA, Koshi H, Ikeda T. Radiation interception and use by maize/peanut intercrop canopy. Agricultural and Forest Meteorology. 2006;139:74–83.
-
- Chamblee DS, Collins M. Relationships with other species in a mixture. In: Hanson AA, Barnes DK, Hill RR Jr, editors. Alfalfa and alfalfa improvement. Madison, WI: American Society of Agronomy; 1988. pp. 439–461.
