

Measuring continuous baseline covariate imbalances in clinical trial data
- PMID: 21865270
- PMCID: PMC4280338
- DOI: 10.1177/0962280211416038
Measuring continuous baseline covariate imbalances in clinical trial data
Abstract
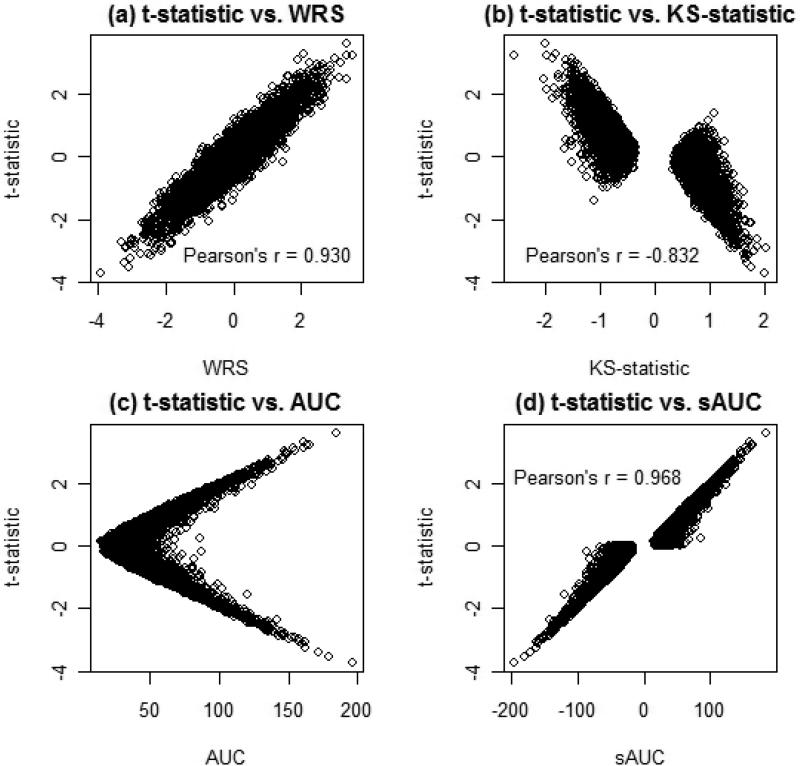
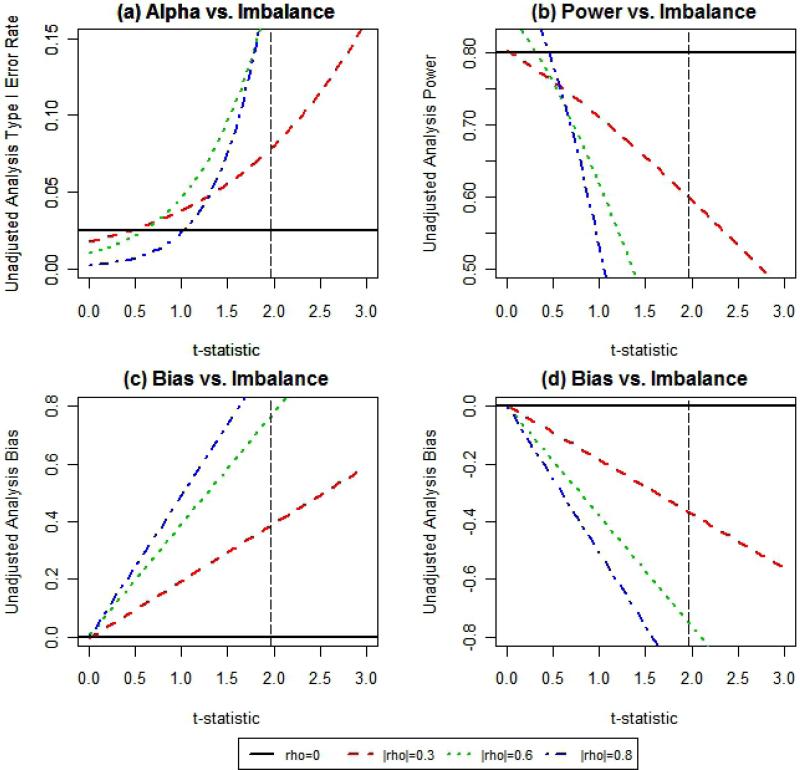
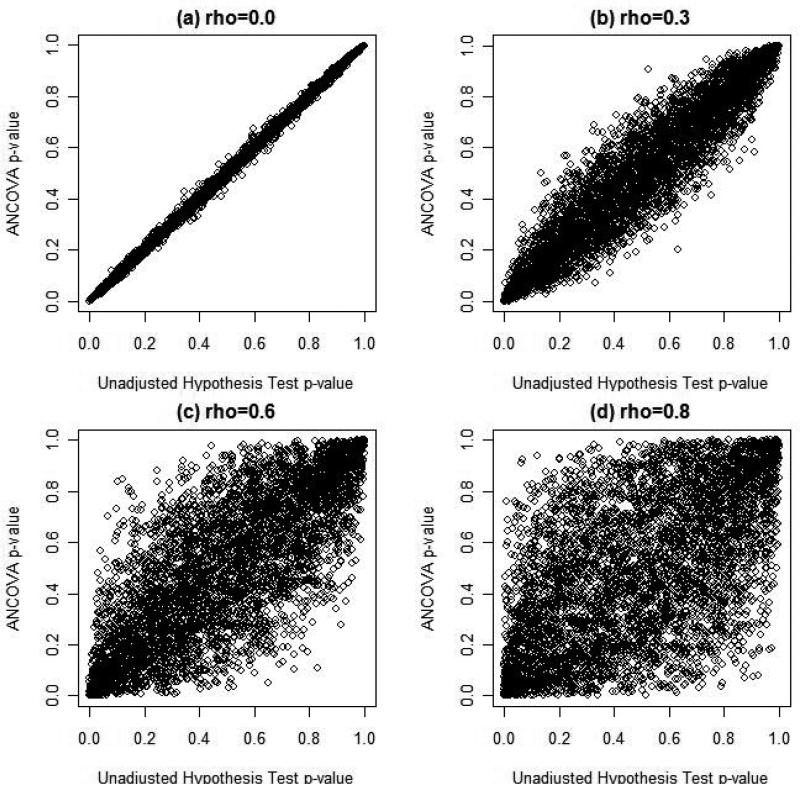
This paper presents and compares several methods of measuring continuous baseline covariate imbalance in clinical trial data. Simulations illustrate that though the t-test is an inappropriate method of assessing continuous baseline covariate imbalance, the test statistic itself is a robust measure in capturing imbalance in continuous covariate distributions. Guidelines to assess effects of imbalance on bias, type I error rate and power for hypothesis test for treatment effect on continuous outcomes are presented, and the benefit of covariate-adjusted analysis (ANCOVA) is also illustrated.
Keywords: baseline; clinical trial; covariate; imbalance.
© The Author(s) 2011 Reprints and permissions: sagepub.co.uk/journalsPermissions.nav.
Figures
References
-
- Friedman LM, Furberg CD, DeMets DL. Fundamentals of clinical trials. 2nd ed. Springer Science + Business Media, LLC; New York: 1998.
-
- Harrington DP. The randomized clinical trial. J Am Stat Assoc. 2000;95:312–315.
-
- Green S. Design of randomized trials. Epidemiol Rev. 2002;24:4–11. - PubMed
-
- McEntegart DJ. The pursuit of balance using stratified and dynamic randomization techniques: An overview. Drug Inf J. 2005;37:293–308.
-
- Rosenberger WF, Lachin JM. Randomization in clinical trials: Theory and practice. Wiley Interscience; New York: 2002.
Publication types
MeSH terms
Substances
Grants and funding
LinkOut - more resources
Full Text Sources
