. 2011 Nov 15;20(22):4360-70.
doi: 10.1093/hmg/ddr363. Epub 2011 Aug 24.

Use of array CGH to detect exonic copy number variants throughout the genome in autism families detects a novel deletion in TMLHE

Affiliations

Use of array CGH to detect exonic copy number variants throughout the genome in autism families detects a novel deletion in TMLHE

Patricia B S Celestino-Soper et al. Hum Mol Genet. .

Abstract

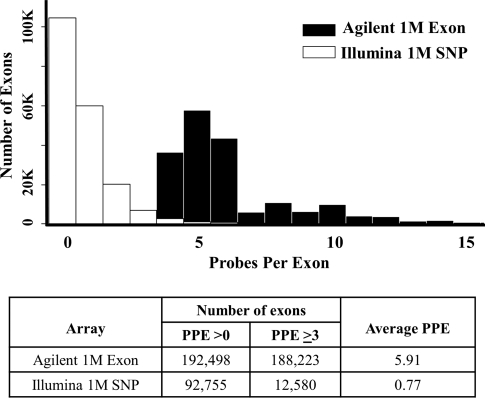
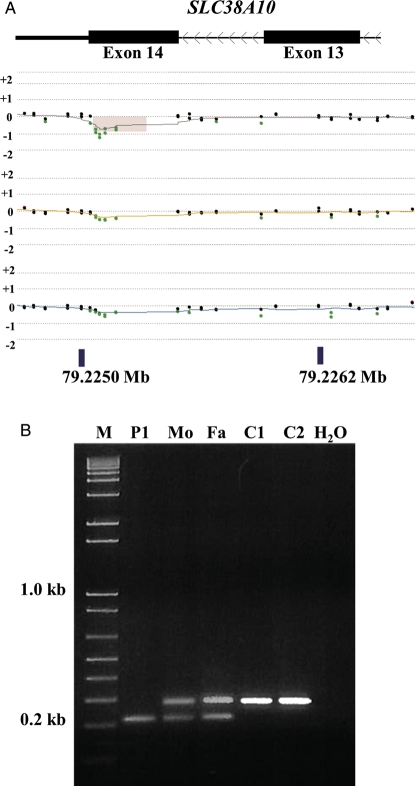
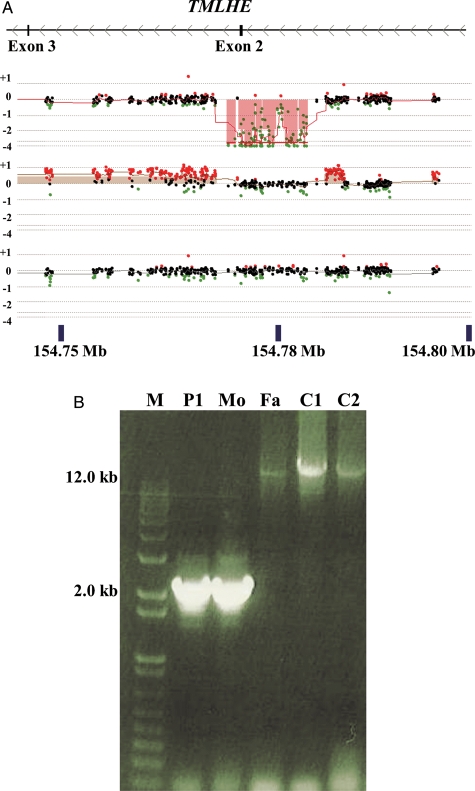
Autism is a neurodevelopmental disorder with increasing evidence of heterogeneous genetic etiology including de novo and inherited copy number variants (CNVs). We performed array comparative genomic hybridization using a custom Agilent 1 M oligonucleotide array intended to cover 197 332 unique exons in RefSeq genes; 98% were covered by at least one probe and 95% were covered by three or more probes with the focus on detecting relatively small CNVs that would implicate a single protein-coding gene. The study group included 99 trios from the Simons Simplex Collection. The analysis identified and validated 55 potentially pathogenic CNVs, categorized as de novo autosomal heterozygous, inherited homozygous autosomal, complex autosomal and hemizygous deletions on the X chromosome of probands. Twenty percent (11 of 55) of these CNV calls were rare when compared with the Database of Genomic Variants. Thirty-six percent (20 of 55) of the CNVs were also detected in the same samples in an independent analysis using the 1 M Illumina single-nucleotide polymorphism array. Findings of note included a common and sometimes homozygous 61 bp exonic deletion in SLC38A10, three CNVs found in lymphoblast-derived DNA but not present in whole-blood derived DNA and, most importantly, in a male proband, an exonic deletion of the TMLHE (trimethyllysine hydroxylase epsilon) that encodes the first enzyme in the biosynthesis of carnitine. Data for CNVs present in lymphoblasts but absent in fresh blood DNA suggest that these represent clonal outgrowth of individual B cells with pre-existing somatic mutations rather than artifacts arising in cell culture. GEO accession number GSE23765 (http://www.ncbi.nlm.nih.gov/geo/, date last accessed on 30 August 2011). Genboree accession: http://genboree.org/java-bin/gbrowser.jsp?refSeqId=1868&entryPointId=chr17&from=53496072&to=53694382&isPublic=yes, date last accessed on 30 August 2011.


Figures

Figure 1.
Figure 1.
Oligonucleotide exonic coverage in Agilent whole-genome custom exon array compared with Illumina 1 M SNP array. The coverage of human exons in the Agilent custom exon and Illumina SNP array was calculated based on the RefSeq database (June 2008, hg18). The 197 332 exons described in Materials and methods were used for these calculations; coverage allowed 300 bp flanking both sides of each exon location. PPE, probes per exon.
Figure 2.
Figure 2.
Validation of complex deletions. (A) Chromosome 14q24.3: relative position of UCSC genome browser RefSeq (UCSC genome browser GRCh37/hg19 assembly) genes (http://genome.ucsc.edu, date last accessed on 30 August 2011) is aligned above the CGH probe plot of proband SSC 11443 (top), mother (middle) and father (bottom). x-axis, chromosome position; y-axis, log 2 ratio. Arrowheads indicate orientation of transcription. Semi-transparent filled boxes on CGH plots highlight the region of aberration. Large gray arrows below genes represent segmental duplications from the UCSC web browser (data last updated: 19 February 2010). Arrows of same color represent regions that share more than 90% similarity. Colored bars below the CGH plot display represent relative position of CNVs from the DGV obtained through the UCSC web browser (data version: v10; data last updated: 22 February 2011). Blue bars represent a gain in copy number compared with the reference; red bars represent a loss in copy number compared with the reference; brown bars represent both a loss and a gain in copy number compared with the reference. (B) A diagram explaining the possible origin of the complex character of deletion at 14q24.3 found in proband SSC 11443 (A) is depicted (see text). Brackets represent a region that is deleted or duplicated in different individuals. Yellow, blue and pink rectangles represent chromosomes that contain a different number of copies of the genomic locus within brackets. Depiction is similar to (A). (C) Chromosome 1q21.3: relative position of UCSC genome browser RefSeq (hg19) genes (http://genome.ucsc.edu, date last accessed on 30 August 2011) is aligned above the CGH probe plot of proband SSC 11417 (top), mother (middle) and father (bottom). Depiction is similar to (A).
Figure 3.
Figure 3.
Validation of homozygous deletion in SLC38A10. (A) The browser display and labels are as in Fig. 2 showing exons 13 and 14 of one isoform of SLC38A10 (UCSC genome browser GRCh37/hg19 assembly). Analysis of family proband SSC 11089 (top), mother (middle) and father (bottom) is shown. (B) PCR for the SSC 11089 family showing the homozygous deletion in the patient (P1) and heterozygous deletion in the mother (Mo) and the father (Fa) but not in the unaffected controls (C1 and C2).
Figure 4.
Figure 4.
Validation of hemizygous deletion of exon 2 of TMLHE. (A) The browser display and labels are as in Fig. 2 showing exons 2 and 3 of TMLHE (UCSC genome browser GRCh37/hg19 assembly). Analysis of family proband SSC 11000 (top), mother (middle) and father (bottom) is shown. (B) PCR for the SSC 11000 family showing the deletion in the patient (P1) and mother (Mo), but not in the father (Fa) or unaffected controls (C1 and C2). There is bias of amplification of the smaller band in the mother so that the normal band is faint.

References

    1. Jacquemont M.-L., Sanlaville D., Redon R., Raoul O., Cormier-Daire V., Lyonnet S., Amiel J., Le M.M., Heron D., De Blois M.-C., et al. Array-based comparative genomic hybridization identifies high frequency of cryptic chromosomal rearrangements in patients with syndromic autism spectrum disorders. J. Med. Genet. 2006;43:843–849. - PMC - PubMed
    1. Miles J.H., Takahashi T.N., Hong J., Munden N., Flournoy N., Braddock S.R., Martin R.A., Bocian M.E., Spence M.A., Hillman R.E., Farmer J.E. Development and validation of a measure of dysmorphology: useful for autism subgroup classification. Am. J. Med. Genet. A. 2008;146A:1101–1116. - PubMed
    1. Sebat J., Lakshmi B., Malhotra D., Troge J., Lese-Martin C., Walsh T., Yamrom B., Yamrom B., Yoon S., Krasnitz A., et al. Strong association of de novo copy number mutations with autism. Science. 2007;316:445–449. - PMC - PubMed
    1. Marshall C.R., Noor A., Vincent J.B., Lionel A.C., Feuk L., Skaug J., Shago M., Moessner R., Pinto D., Ren Y., et al. Structural variation of chromosomes in autism spectrum disorder. Am. J. Hum. Genet. 2008;82:477–488. - PMC - PubMed
    1. Scott F.J., Baron-Cohen S., Bolton P., Brayne C. Brief report: prevalence of autism spectrum conditions in children aged 5–11 years in Cambridgeshire, UK. Autism. 2002;6:231–237. - PubMed

Publication types

Substances