. 2011 Nov 24;118(22):5891-900.
doi: 10.1182/blood-2011-06-358382. Epub 2011 Aug 24.

Diagnostic microRNA profiling in cutaneous T-cell lymphoma (CTCL)

Affiliations

Diagnostic microRNA profiling in cutaneous T-cell lymphoma (CTCL)

Ulrik Ralfkiaer et al. Blood. .

Abstract

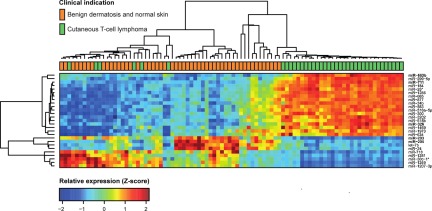
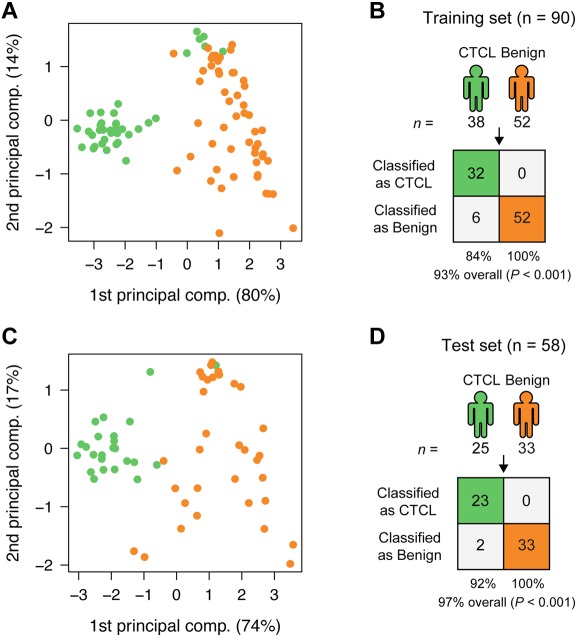
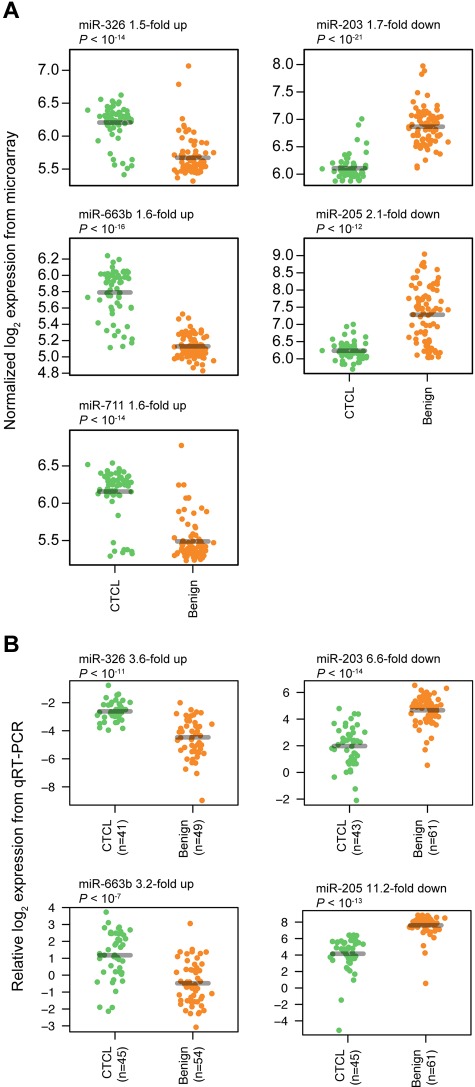
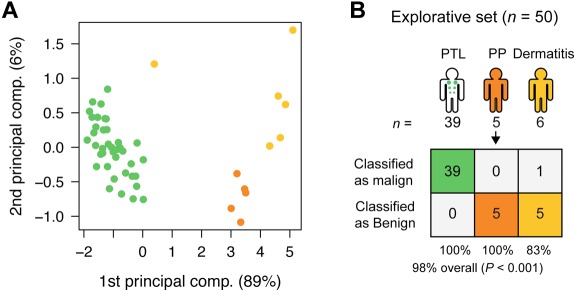
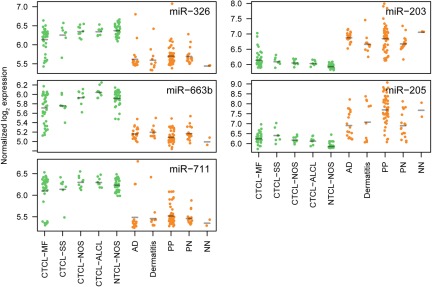
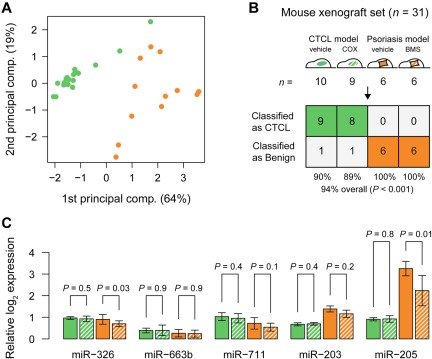
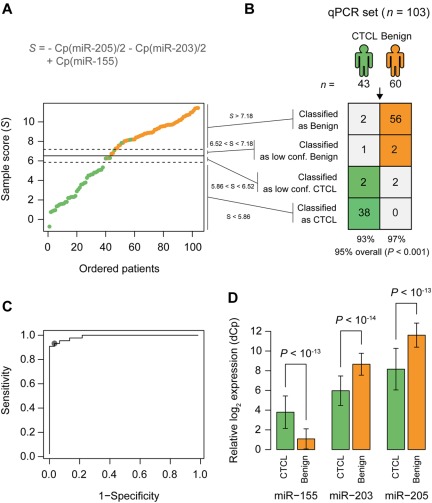
Cutaneous T-cell lymphomas (CTCLs) are the most frequent primary skin lymphomas. Nevertheless, diagnosis of early disease has proven difficult because of a clinical and histologic resemblance to benign inflammatory skin diseases. To address whether microRNA (miRNA) profiling can discriminate CTCL from benign inflammation, we studied miRNA expression levels in 198 patients with CTCL, peripheral T-cell lymphoma (PTL), and benign skin diseases (psoriasis and dermatitis). Using microarrays, we show that the most induced (miR-326, miR-663b, and miR-711) and repressed (miR-203 and miR-205) miRNAs distinguish CTCL from benign skin diseases with > 90% accuracy in a training set of 90 samples and a test set of 58 blinded samples. These miRNAs also distinguish malignant and benign lesions in an independent set of 50 patients with PTL and skin inflammation and in experimental human xenograft mouse models of psoriasis and CTCL. Quantitative (q)RT-PCR analysis of 103 patients with CTCL and benign skin disorders validates differential expression of 4 of the 5 miRNAs and confirms previous reports on miR-155 in CTCL. A qRT-PCR-based classifier consisting of miR-155, miR-203, and miR-205 distinguishes CTCL from benign disorders with high specificity and sensitivity, and with a classification accuracy of 95%, indicating that miRNAs have a high diagnostic potential in CTCL.


Figures

Figure 1
Figure 1
Expression profiles in training set for highly significant miRNAs. We analyzed microarray measurements of 688 miRNAs in the training set of 90 samples with t tests to discover differences in expression between samples of subjects with CTCL and those of BDN subjects. The 27 miRNAs that displayed highly significant (Bonferroni corrected P < .001) and strong differences (at least 50% change) are presented in the heat map. Samples are arranged in columns, miRNAs in rows, and both are hierarchically clustered using Euclidean distance with average linkage of nodes. Red-to-yellow shades indicate increased relative expression; blue shades indicate reduced expression; green indicates median expression. The top 5 most significantly induced or repressed miRNAs are shown in bold.
Figure 2
Figure 2
Classification of CTCL and BDN. (A) PCA plot of samples from subjects with CTCL (green) and those of BDN subjects (orange) in the training set based on the 5-miRNA profile identified by the nearest shrunken centroids (NSC) algorithm. Percentages indicate percentage of variance explained by that component. (B) Classification performance in the training set using the NSC algorithm. P values were calculated using Fisher exact test. (C) PCA plot of samples in the test set based on the 5-miRNA profile identified from the training set. (D) Classification performance in the test set using the trained NSC algorithm.
Figure 3
Figure 3
Classifier miRNA expressions measured by microarray and qRT-PCR. For each miRNA, expressions are grouped according to patient type (CTCL and BDN, respectively), with a small scatter on the x-axis within each group to allow better visualization of all measurements. P values were calculated using a t test. (A) Expressions measured by microarray. (B) Expressions measured by qRT-PCR.
Figure 4
Figure 4
Classification of PTL and dermatitis. (A) PCA plot of samples from subjects with PTL (green), dermatitis (light orange), and psoriasis (yellow) for comparison, in the explorative set, based on the 5-miRNA profile. (B) Classification performance in the explorative set using the trained NSC algorithm. See Table 1 for explanation of PP.
Figure 5
Figure 5
Overview of miRNA expressions measured by microarray for the miRNAs in the classifier for all sub indications included in the study. For each miRNA, expressions are grouped according to sub indication (same abbreviations as in Table 1).
Figure 6
Figure 6
Classification of treated and untreated CTCL and psoriasis from mouse xenograft models. (A) PCA plot of all samples from mouse xenograft CTCL model (green), and psoriasis model (orange), based on the 5-miRNA profile. Solid bars indicate vehicle controls, whereas hatched green bars indicate systemic treatment with a COX-2 inhibitor (celecoxib) and hatched orange bars indicate topical treatment with steroid (betamethasone). (B) Classification performance in the mouse xenograft set using the trained 5-miRNA classifier. (C) Bar plots showing normalized log2 expression levels relative to average of lowest expressions measured across all samples. Error bars denote ± 1 SD. For each miRNA, P values were calculated using a t test between treated and untreated samples from each model, respectively.
Figure 7
Figure 7
qRT-PCR–based classification of samples from patients with CTCL and benign skin disease. (A) A Cp based sample score (S) were calculated for each sample. Patients are ordered by increasing values of this score. The solid line shows the cutoff between patients with CTCL (green) and patients with benign skin disease (orange). The dotted lines show the cutoffs for the low confidence region. (B) Classification performance using the cutoffs defined in panel A. P values were calculated using Fisher exact test. (C) ROC curve ROC showing the sensitivity and specificity for various cutoff values on the sample score of the samples. (D) Relative expression of the 3 miRNAs used in the classification in samples from patients with CTCL and benign skin disease. Error bars indicate ± 1 SD.

Comment in

References

    1. Bradford PT, Devesa SS, Anderson WF, Toro JR. Cutaneous lymphoma incidence patterns in the United States a population-based study of 3884 cases. Blood. 2009;113(21):5064–5073. - PMC - PubMed
    1. Trautinger F, Knobler R, Willemze R, et al. EORTC consensus recommendations for the treatment of mycosis fungoides/Sézary syndrome. Eur J Cancer. 2006;42(8):1014–1030. - PubMed
    1. Lee BN, Duvic M, Tang CK, et al. Dysregulated synthesis of intracellular type 1 and type 2 cytokines by T cells of patients with cutaneous T-cell lymphoma. Clin Diagn Lab Immunol. 1999;6(1):79–84. - PMC - PubMed
    1. Gjerdrum LM, Woetmann A, Odum N, et al. FOXP3+ regulatory T cells in cutaneous T-cell lymphomas association with disease stage and survival. Leukemia. 2007;21(12):2512–2518. - PubMed
    1. Rosen ST, Querfeld C. Primary cutaneous T-cell lymphomas. Hematol Am Soc Hematol Educ Program. 2006;323:330. - PubMed

Publication types