. 2011 Oct 20;118(16):4384-93.
doi: 10.1182/blood-2011-02-338517. Epub 2011 Aug 24.

Clonal drift demonstrates unexpected dynamics of the T-cell repertoire in T-large granular lymphocyte leukemia

Affiliations

Clonal drift demonstrates unexpected dynamics of the T-cell repertoire in T-large granular lymphocyte leukemia

Michael J Clemente et al. Blood. .

Erratum in

  • Blood. 2012 Aug 30;120(9):1963. His, Eric D [corrected to Hsi, Eric D]

Abstract

T-cell large granular lymphocyte leukemia (T-LGLL) is characterized by chronic lymphoproliferation of cytotoxic T lymphocytes (CTLs) and is associated with lineage-restricted cytopenias. Introduction of T-cell receptor (TCR) variable β-chain (Vβ) monoclonal antibodies has facilitated identification and enumeration of clonal CTLs by flow cytometry. A highly skewed TCR Vβ repertoire identified by flow cytometry is strongly associated with monoclonal CDR3 regions by quantitative sequencing and positive TCRγ rearrangement assays. Therefore, Vβ expansions can serve as surrogate markers of CTL clonality to assess clonal kinetics in T-LGLL. We analyzed the TCR repertoire in 143 patients, 71 of which were available for serial measurements over 6 to 96 months. Although the majority (38/71, 54%) maintained a consistent monoclonal expansion, many (26/71, 37%) unexpectedly displayed a change in the dominant clone, whereby the original CTL clone contracted and another emerged as demonstrated by Vβ typing. Our results demonstrate that the T-cell repertoire is more dynamic in T-LGLL than recognized previously, illustrating the heterogeneity of disorders under this categorization.


Figures
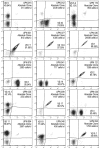
Figure 1
Figure 1
Vβ expansions can dominate the CD8 TCR repertoire and are effectively detected by flow cytometry via fluorescently labeled monoclonal antibodies against specific variable β regions. Representative flow plots of LGL patients gated on lymphocytes that are CD3+CD8+, each panel is 1 patient identified by a unique patient number (UPN). Plots may represent other measurements than baseline for each patient.
Figure 2
Figure 2
Vβ expansions across the cohort. Each black bar shows the percentage of the CD8 T-cell population expressing a specific Vβ region. Gray boxes represent the mean + 3 SD of the control population. VβX accounts for Vβ gene products not recognized by the flow cytometry assay and is calculated by subtraction of the sum of all Vβ recognized by the assay from 100.
Figure 3
Figure 3
Analysis of Vβ expansions over time reveals a heterogeneous clonal course in the study population. (A) Representative patient with borderline oligoclonal expansions at the initial observation (left pie representation black bars) that, by the most recent time point, had changed to monoclonal (right pie white bars). (B) Patient with biclonal expansion shown at baseline, then CD8+ T cells expressing Vβ3 decreased, whereas Vβ7.1 became dominant. (C) Patient shown with an initial extreme monoclonal expansion that became biclonal. (D) Patient with unchanging monoclonal expansion. Gray bars represent the mean of the control population and error bars are the mean + 3 SD. Similar results were obtained using absolute counts. All patients shown in this figure were followed for roughly 2 years. (E) Of the 143 patients in our cohort, 71 were available for long term Vβ follow-up beyond 6 months. Twenty-six of 71 patients demonstrated clone switching as detected by flow cytometry; graphs of 8 representative patients are depicted here. The interval between time points varied from 6 months to 1 year.
Figure 4
Figure 4
Long-term TCR repertoire monitoring may have potential as a biomarker for disease progression. Two patients were followed for 8 years. (A) Patient demonstrates an initial biclonal expansion that became monoclonal and then decreased during hematologic remission after therapy. When the clone re-expanded, remission was maintained with the resumption of therapeutic intervention. (B) Patient with initial biclonal expansion that became monoclonal after treatment entered hematologic remission despite the presence of a clone that dominated the TCR repertoire. Emergence of a new clone (Vβ12) preceded relapse and eventually required further intervention. At the most recent measurement, this clone now accounts for > 80% of CD8 T cells. Amino acid sequences of the expanded T-cell populations are shown next to relevant time points.
Figure 5
Figure 5
Absolute clone count by Vβ flow cytometry can be used to monitor therapy, and survival data suggest possible association with clone switching. Absolute clone size tends to decrease in responders to therapeutic intervention (n = 23) versus nonresponders (n = 26; matched pairs analysis, P = .024). Response was determine by hematologic improvement. (A) Patients with full hematologic remission (left panel broken lines) and patients with partial remission (left panel full lines) tend to demonstrate a decrease in absolute clone size. Patients who do not respond to therapy with no change in hematologic status (right panel broken lines) and patients whose condition deteriorated during treatment (right panel full lines) tend to exhibit an increase in absolute clone size. (B) Patients who displayed an increase in ANC as absolute clone count decreased. Although the proportion of clonal cells increased markedly after time point 6, the ACC increase was more modest and was accompanied by an increase in ANC by the most recent time point. (C) Subgroup analysis of patients with neutropenia who responded to various therapies (n = 23; cytoxan, cyclosporine, campath) demonstrate a significant increase in ANC. Clearly nonsignificant survival data are demonstrated for the presence of > 1 Vβ expansion (D bottom line), whereas patients with anemia (E bottom line) and lymphopenia (F bottom line) tend to do much worse. Clone switching (G bottom line) may have a relationship with survival, but at this analysis the data do not yield statistically significant results.

References

    1. Loughran TP., Jr Clonal diseases of large granular lymphocytes. Blood. 1993;82(1):1–14. - PubMed
    1. Lamy T, Loughran TP., Jr Clinical features of large granular lymphocyte leukemia. Semin Hematol. 2003;40(3):185–195. - PubMed
    1. Loughran TP, Jr, Starkebaum G. Large granular lymphocyte leukemia. Report of 38 cases and review of the literature. Medicine. 1987;66(5):397–405. - PubMed
    1. Sokol L, Loughran TP., Jr Large granular lymphocyte leukemia. Oncologist. 2006;11(3):263–273. - PubMed
    1. Wong KF, Yip SF, So CC, Lau GT, Yeung YM. Cytomegalovirus infection associated with clonal proliferation of T-cell large granular lymphocytes: causal or casual? Cancer Genet Cytogenet. 2003;142(1):77–79. - PubMed

Publication types

MeSH terms

Substances