

The HIV/AIDS vaccine candidate MVA-B administered as a single immunogen in humans triggers robust, polyfunctional, and selective effector memory T cell responses to HIV-1 antigens
- PMID: 21865377
- PMCID: PMC3194965
- DOI: 10.1128/JVI.05165-11
The HIV/AIDS vaccine candidate MVA-B administered as a single immunogen in humans triggers robust, polyfunctional, and selective effector memory T cell responses to HIV-1 antigens
Abstract
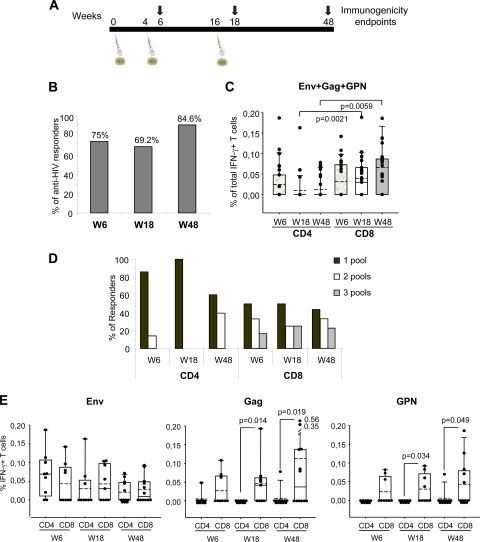
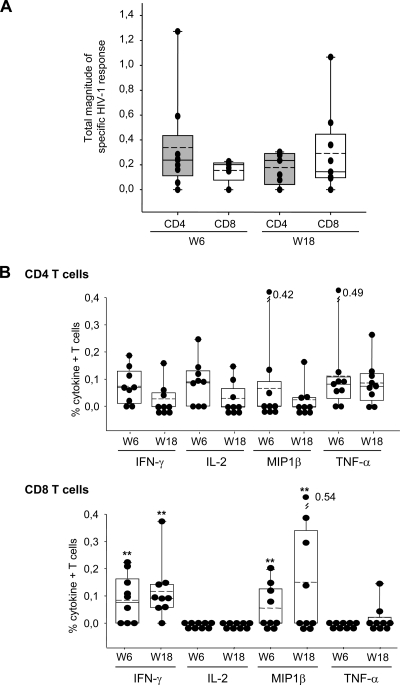
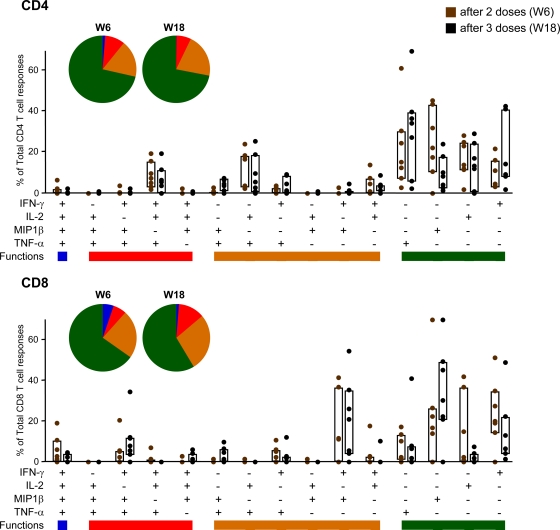
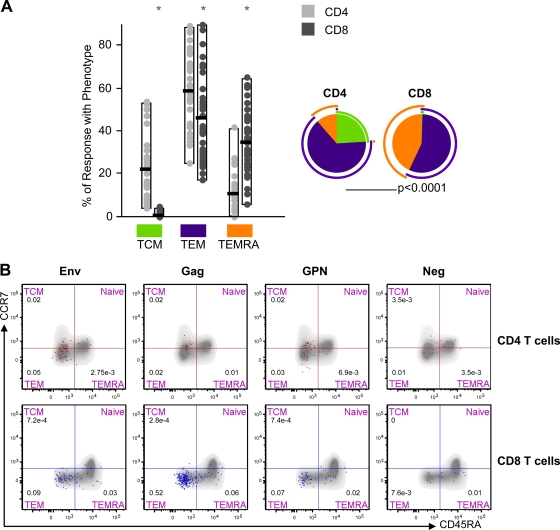
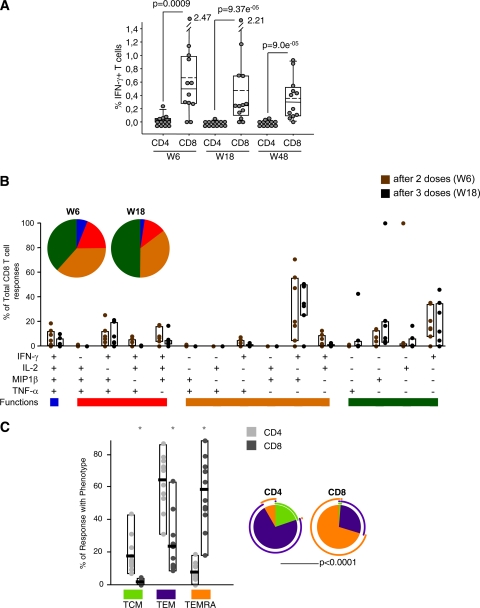
Attenuated poxvirus vectors expressing human immunodeficiency virus type 1 (HIV-1) antigens are considered promising HIV/AIDS vaccine candidates. Here, we describe the nature of T cell immune responses induced in healthy volunteers participating in a phase I clinical trial in Spain after intramuscular administration of three doses of the recombinant MVA-B-expressing monomeric gp120 and the fused Gag-Pol-Nef (GPN) polyprotein of clade B. The majority (92.3%) of the volunteers immunized had a positive specific T cell response at any time postvaccination as detected by gamma interferon (IFN-γ) intracellular cytokine staining (ICS) assay. The CD4(+) T cell responses were predominantly Env directed, whereas the CD8(+) T cell responses were similarly distributed against Env, Gag, and GPN. The proportion of responders after two doses of MVA-B was similar to that obtained after the third dose of MVA-B vaccination, and the responses were sustained (84.6% at week 48). Vaccine-induced CD8(+) T cells to HIV-1 antigens after 1 year were polyfunctional and distributed mainly within the effector memory (TEM) and terminally differentiated effector memory (TEMRA) T cell populations. Antivector T cell responses were mostly induced by CD8(+) T cells, highly polyfunctional, and of TEMRA phenotype. These findings demonstrate that the poxvirus MVA-B vaccine candidate given alone is highly immunogenic, inducing broad, polyfunctional, and long-lasting CD4 and CD8 T cell responses to HIV-1 antigens, with preference for TEM. Thus, on the basis of the immune profile of MVA-B in humans, this immunogen can be considered a promising HIV/AIDS vaccine candidate.
Figures
Similar articles
-
Generation and immunogenicity of novel HIV/AIDS vaccine candidates targeting HIV-1 Env/Gag-Pol-Nef antigens of clade C.Vaccine. 2007 Mar 1;25(11):1969-92. doi: 10.1016/j.vaccine.2006.11.051. Epub 2006 Dec 6. Vaccine. 2007. PMID: 17224219
-
Broad and potent immune responses to a low dose intradermal HIV-1 DNA boosted with HIV-1 recombinant MVA among healthy adults in Tanzania.Vaccine. 2011 Oct 26;29(46):8417-28. doi: 10.1016/j.vaccine.2011.08.001. Epub 2011 Aug 22. Vaccine. 2011. PMID: 21864626 Free PMC article. Clinical Trial.
-
Improving Adaptive and Memory Immune Responses of an HIV/AIDS Vaccine Candidate MVA-B by Deletion of Vaccinia Virus Genes (C6L and K7R) Blocking Interferon Signaling Pathways.PLoS One. 2013 Jun 27;8(6):e66894. doi: 10.1371/journal.pone.0066894. Print 2013. PLoS One. 2013. PMID: 23826170 Free PMC article.
-
Poxvirus vectors as HIV/AIDS vaccines in humans.Hum Vaccin Immunother. 2012 Sep;8(9):1192-207. doi: 10.4161/hv.20778. Epub 2012 Aug 21. Hum Vaccin Immunother. 2012. PMID: 22906946 Free PMC article. Review.
-
Clinical experience with plasmid DNA- and modified vaccinia virus Ankara-vectored human immunodeficiency virus type 1 clade A vaccine focusing on T-cell induction.J Gen Virol. 2007 Jan;88(Pt 1):1-12. doi: 10.1099/vir.0.82493-0. J Gen Virol. 2007. PMID: 17170430 Review.
Cited by
-
The role of TEMRA cell-mediated immune senescence in the development and treatment of HIV disease.Front Immunol. 2023 Oct 12;14:1284293. doi: 10.3389/fimmu.2023.1284293. eCollection 2023. Front Immunol. 2023. PMID: 37901239 Free PMC article. Review.
-
Deletion of the vaccinia virus N2L gene encoding an inhibitor of IRF3 improves the immunogenicity of modified vaccinia virus Ankara expressing HIV-1 antigens.J Virol. 2014 Mar;88(6):3392-410. doi: 10.1128/JVI.02723-13. Epub 2014 Jan 3. J Virol. 2014. PMID: 24390336 Free PMC article.
-
Monocytes Phenotype and Cytokine Production in Human Immunodeficiency Virus-1 Infected Patients Receiving a Modified Vaccinia Ankara-Based HIV-1 Vaccine: Relationship to CD300 Molecules Expression.Front Immunol. 2017 Jul 21;8:836. doi: 10.3389/fimmu.2017.00836. eCollection 2017. Front Immunol. 2017. PMID: 28785262 Free PMC article.
-
Safety and vaccine-induced HIV-1 immune responses in healthy volunteers following a late MVA-B boost 4 years after the last immunization.PLoS One. 2017 Oct 24;12(10):e0186602. doi: 10.1371/journal.pone.0186602. eCollection 2017. PLoS One. 2017. PMID: 29065142 Free PMC article. Clinical Trial.
-
Multivalent MVA-vectored vaccine elicits EBV neutralizing antibodies in rhesus macaques that reduce EBV infection in humanized mice.Front Immunol. 2024 Sep 13;15:1445209. doi: 10.3389/fimmu.2024.1445209. eCollection 2024. Front Immunol. 2024. PMID: 39346922 Free PMC article.
References
-
- Champagne P., et al. 2001. Skewed maturation of memory HIV-specific CD8 T lymphocytes. Nature 410:106–111 - PubMed
-
- Dubey S., et al. 2007. Detection of HIV vaccine-induced cell-mediated immunity in HIV-seronegative clinical trial participants using an optimized and validated enzyme-linked immunospot assay. J. Acquir. Immune Defic. Syndr. 45:20–27 - PubMed
Publication types
MeSH terms
Substances
LinkOut - more resources
Full Text Sources
Other Literature Sources
Medical
Research Materials
