. 2011 Nov;85(21):10955-67.
doi: 10.1128/JVI.05792-11. Epub 2011 Aug 24.

Host regulatory network response to infection with highly pathogenic H5N1 avian influenza virus

Affiliations

Host regulatory network response to infection with highly pathogenic H5N1 avian influenza virus

Chengjun Li et al. J Virol. 2011 Nov.

Abstract

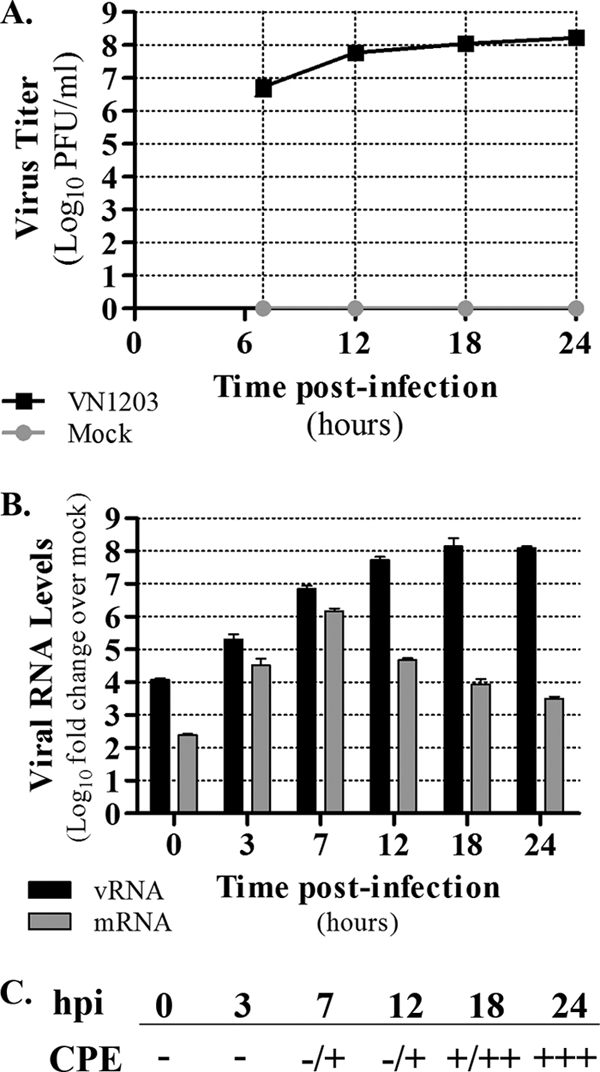
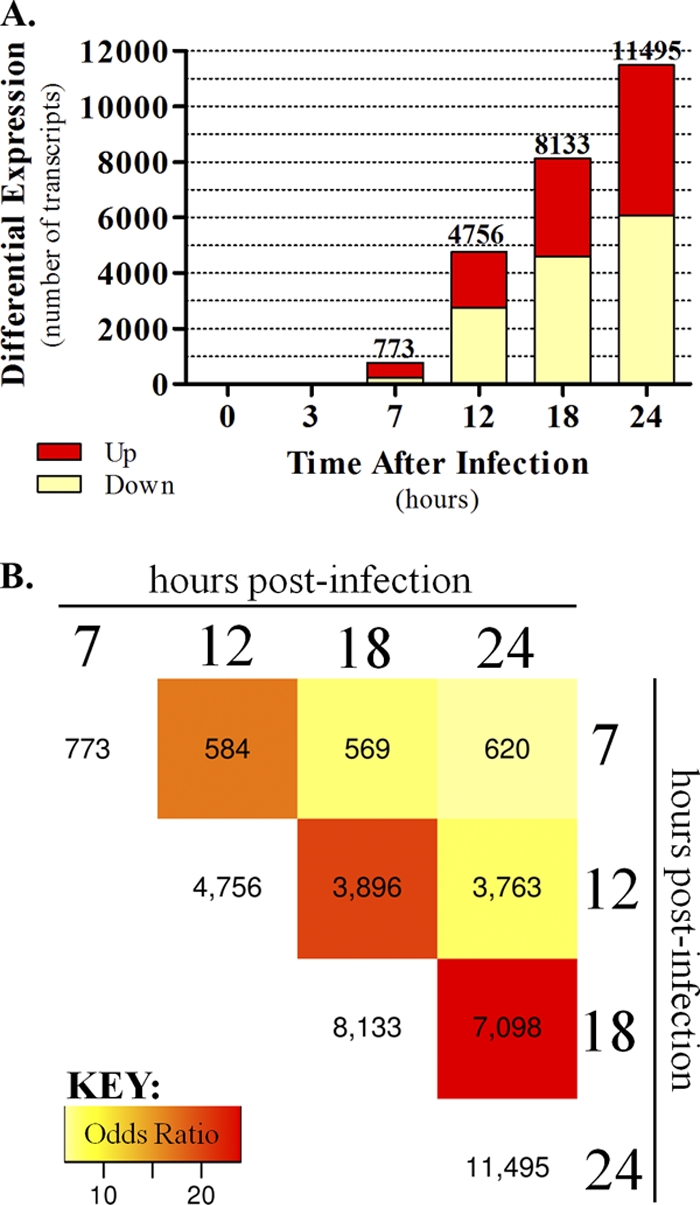
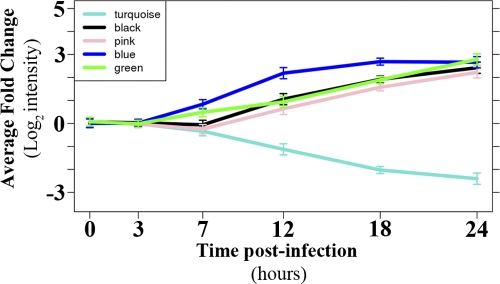
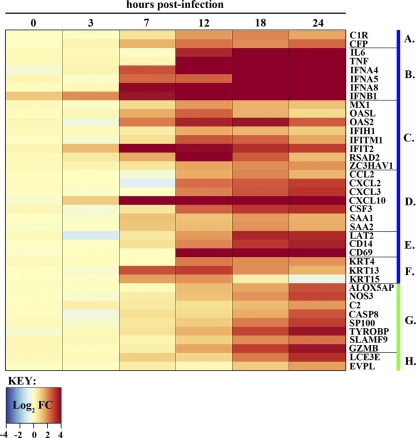
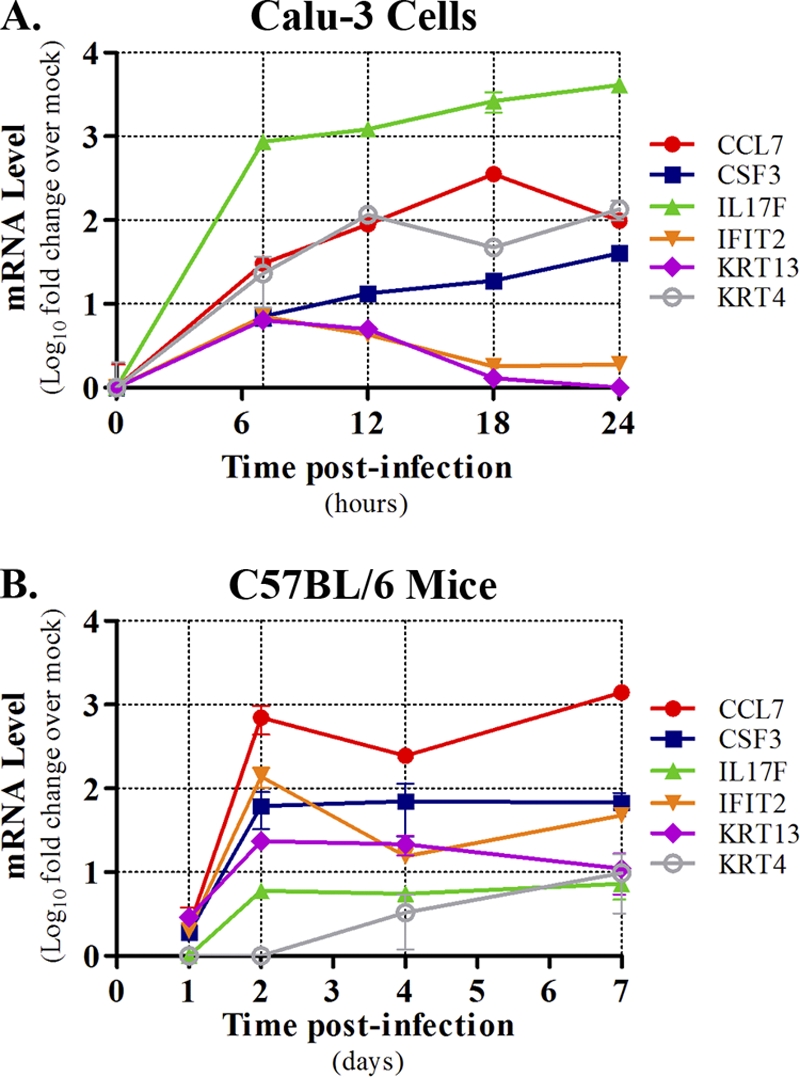
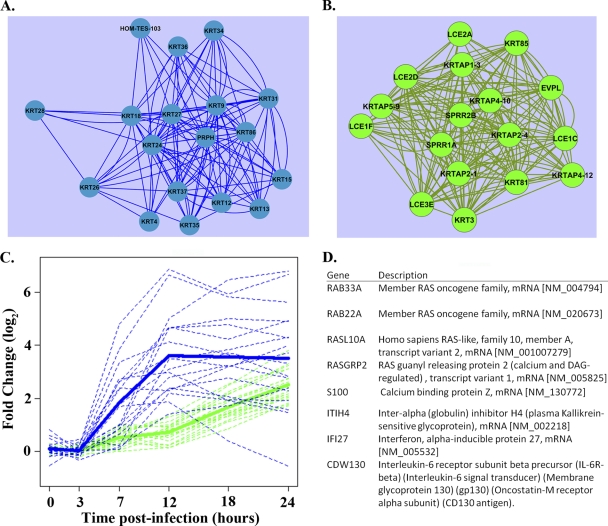
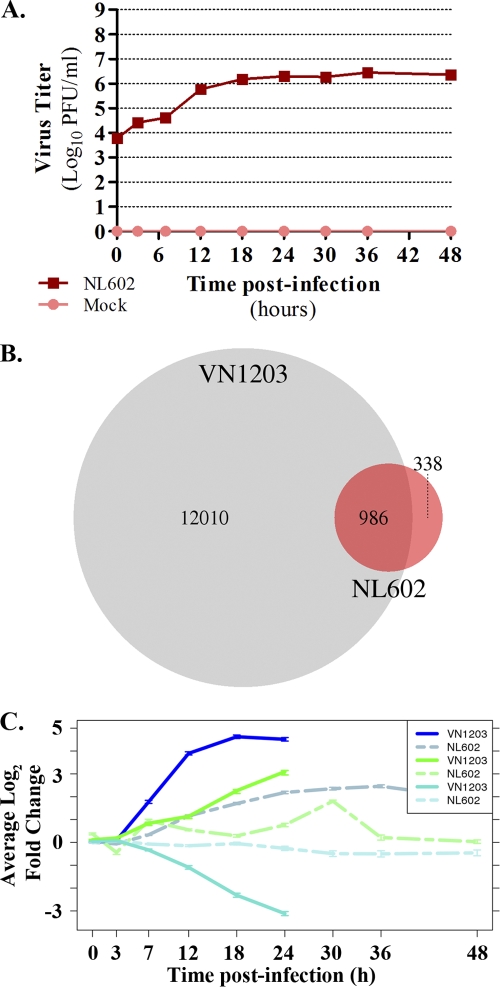
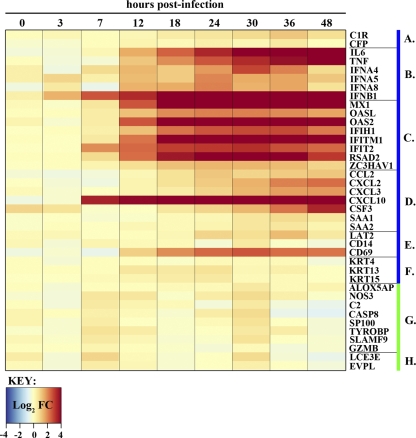
During the last decade, more than half of humans infected with highly pathogenic avian influenza (HPAI) H5N1 viruses have died, yet virus-induced host signaling has yet to be clearly elucidated. Airway epithelia are known to produce inflammatory mediators that contribute to HPAI H5N1-mediated pathogenicity, but a comprehensive analysis of the host response in this cell type is lacking. Here, we leveraged a system approach to identify and statistically validate signaling subnetworks that define the dynamic transcriptional response of human bronchial epithelial cells after infection with influenza A/Vietnam/1203/2004 (H5N1, VN1203). Importantly, we validated a subset of transcripts from one subnetwork in both Calu-3 cells and mice. A more detailed examination of two subnetworks involved in the immune response and keratinization processes revealed potential novel mediators of HPAI H5N1 pathogenesis and host response signaling. Finally, we show how these results compare to those for a less virulent strain of influenza virus. Using emergent network properties, we provide fresh insight into the host response to HPAI H5N1 virus infection and identify novel avenues for perturbation studies and potential therapeutic interventions for fatal HPAI H5N1 disease.


Figures

Fig. 1.
Fig. 1.
VN1203 infection of Calu-3 cells. (A) Calu-3 cells were infected with VN1203 (MOI of 1), and supernatants were harvested for the quantification of infectious virus production by plaque assay in MDCK cells. Log10 viral titers are shown for 7, 12, 18, and 24 h postinfection (hpi), with variation indicated by ± standard deviations for six biological replicates. (B) The level of segment 5 (nucleoprotein; NP) genomic viral RNA and mRNA was determined by qPCR for each time point (0, 3, 7, 12, 18, and 24 hpi). Note that the 0-h time point was designated the end of the incubation period with virus inocula. Values represent the average log10 fold changes relative to levels for time-matched mock-infected control samples, and variation is indicated by ± standard deviations from three biological replicates. (C) CPE was microscopically assessed at each time point, and the level is indicated using a +/− scale as described in Materials and Methods.
Fig. 2.
Fig. 2.
Differential gene expression in VN1203 infections. (A) Total cellular RNA was harvested from the same infected monolayers as those described for Fig. 1, and we used microarray analysis to identify 13,156 transcripts that were differentially expressed (DE) (DE means an absolute log2 fold change of 1.5 and an FDR-adjusted P value of <0.05) in at least one time point after VN1203 infection. DE was determined by comparing VN1203-infected samples to time-matched mock-infected controls. The total number of differentially expressed genes is indicated above each time point bar, and upregulated and downregulated genes are indicated by the red and light yellow portions of the stacked bars, respectively. (B) The overlap in DE between all time points was found to be significant (<10−6 by Fisher's exact test). The heat map shows the number of common DE transcripts between all time points after 7 hpi. Heat map colors represent odds ratio values and an increasing overlap for later time points.
Fig. 3.
Fig. 3.
VN1203 host response module dynamics. Calu-3 gene expression data were used to construct a host response network from which subnetworks, or modules, were identified as highly connected groups of transcripts. Average log2 fold changes are shown for selected significant VN1203 host response modules, which also are briefly described in Table 1. Lines are colored according to module color designation, and error bars represent standard deviations. Individual average module dynamics are shown for every significant module in Fig. A3 in the appendix.
Fig. 4.
Fig. 4.
Expression dynamics of selected blue and green module transcripts that intersect with upregulated transcripts in VN1203-infected mice (8). Fold changes (FC) for individual transcripts are depicted on a log2 scale, with a blue-to-dark-red gradient indicating down- and upregulation, respectively. Time points are shown at the top, and specific gene names are indicated to the right. Genes are grouped according to membership in either the blue or green module (denoted by the blue or green bars to the right of the gene name) and function: (A) complement, (B) acute phase response cytokines, (C) interferon stimulated genes, (D) molecules with chemotactic activity, (E) immune signaling molecules, (F) keratin genes, (G) other immune response-related molecules, and (H) keratinization genes.
Fig. 5.
Fig. 5.
Validation of specific blue module transcripts in VN1203-infected Calu-3 cells and C57BL/6 mouse lungs. Total RNA isolated from VN1203-infected Calu-3 cultures (A) or lungs of VN1203-infected mice (B) was subjected to qPCR using gene-specific primers. Transcript fold changes were quantified based on time-matched mock-infected controls and are expressed as log10 mean values ± standard deviations from at least two biological replicates. The model system is indicated above each panel, and a key is shown to the right of each graph.
Fig. 6.
Fig. 6.
Evidence of keratinization signaling. Both blue and green correlation network modules were found to be enriched for GO biological categories related to keratin filaments and keratinization. We examined the top 5% strongest connections of each keratin-associated gene product and illustrate their intraconnected edges in the blue (A) and green (B) modules. (C) The graph shows that members of the blue module are induced earlier than members of the green module. Thick lines represent average log2 fold changes of members of graphs A and B, and the dotted lines represent individual transcript dynamics. (D) The blue module keratin-associated gene products were found to be highly connected with RAS signaling transcripts. The table lists transcripts found in the top 1% strongest connections to graph A. Connectivity was assessed using the topological overlap measure (see Appendix).
Fig. 7.
Fig. 7.
NL602 replication and host DE in Calu-3 cells. Calu-3 cells were infected with influenza A/Netherlands/602/2009 (H1N1) and subjected to microarray analysis at 0, 3, 7, 12, 18, 24, 30, 36, and 48 hpi. (A) Virus titers in the supernatants (six replicates) were quantified by plaque assay in MDCK cells and are represented on a log10 scale ± standard deviations. (B) Host differential expression was quantified for NL602 infections as described for VN1203, and considerably fewer transcripts were differentially expressed in Calu-3 cells infected with NL602 (1,731) than with VN1203 (13,156). As indicated by the Venn diagram, a significant number of these transcripts (986) were common between viruses (P < 10−6 by Fisher's exact test). (C) Comparison of blue, green, and turquoise module transcripts (modules identified for VN1203) in common between VN1203 and NL602. The average log2 fold changes of DE transcripts are shown, with solid lines representing DE in VN1203 infections and dotted lines representing DE in NL602 infections. Line graph colors correspond to module names, and error bars correspond to standard errors.
Fig. 8.
Fig. 8.
Host transcript expression profile in NL602-infected Calu-3 cells. A heat map shows NL602 cellular gene expression over time for the same transcripts as those shown in Fig. 4. Fold changes for individual transcripts are depicted on a log2 scale, with a blue-to-dark-red gradient indicating down- and upregulation, respectively. The gene groups depicted in lanes A to H are the same as those described in the Fig. 4 legend.
Fig. A1.
Fig. A1.
Flowchart of the microarray module analysis pipeline used to identify subnetworks describing the transcriptional host response to VN1203 infection.
Fig. A2.
Fig. A2.
(A) Dendrogram describes the transcriptional host response network structure. Transcripts are represented as vertical lines and are arranged in branches according to TO similarity using hierarchical clustering. The dynamic treecut algorithm was used to automatically detect 20 highly connected subnetworks or modules, referred to by a color designation. Module color designations are shown below the heat map, and time points are to the left. (B) Modules are summarized as eigengenes by taking the first principal component of the module member's intensity values. Heat map colors indicate relative direction and intensity of each module's eigengene for a given time point according to a Kruskal-Wallis statistic. Shades of red indicate upregulation, while shades of green indicate downregulation.
Fig. A3.
Fig. A3.
Twelve modules were identified as host response subnetworks that are significantly connected using the topological overlap measure. For each plot, gray lines mark averaged log2 intensities for individual module transcripts, with the subset of transcripts upregulated at 7 hpi represented by black dashed lines. Thick lines represent the average module log2 intensity and are colored according to module color designation. The total number of transcripts mapping to each module is indicated above each plot.

References

    1. Albert R. 2005. Scale-free networks in cell biology. J. Cell Sci. 118:4947–4957 - PubMed
    1. Beigel J. H., et al. 2005. Avian influenza A (H5N1) infection in humans. N. Engl. J. Med. 353:1374–1385 - PubMed
    1. Brass A. L., et al. 2009. The IFITM proteins mediate cellular resistance to influenza A H1N1 virus, West Nile virus, and dengue virus. Cell 139:1243–1254 - PMC - PubMed
    1. Brydon E. W., Smith H., Sweet C. 2003. Influenza A virus-induced apoptosis in bronchiolar epithelial (NCI-H292) cells limits pro-inflammatory cytokine release. J. Gen. Virol. 84:2389–2400 - PubMed
    1. Cameron C. M., et al. 2008. Gene expression analysis of host innate immune responses during lethal H5N1 infection in ferrets. J. Virol. 82:11308–11317 - PMC - PubMed