

MRI apparent diffusion coefficient reflects histopathologic subtype, axonal disruption, and tumor fraction in diffuse-type grade II gliomas
- PMID: 21865401
- PMCID: PMC3199150
- DOI: 10.1093/neuonc/nor122
MRI apparent diffusion coefficient reflects histopathologic subtype, axonal disruption, and tumor fraction in diffuse-type grade II gliomas
Abstract
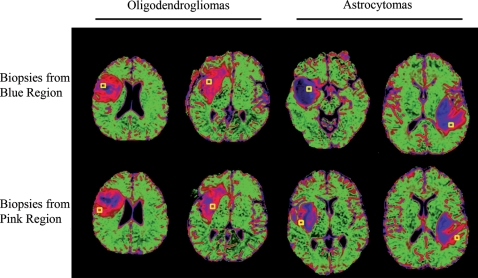
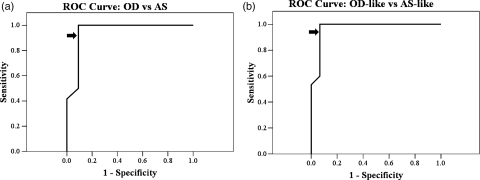
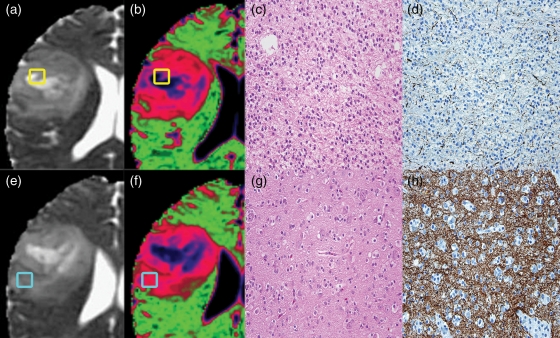
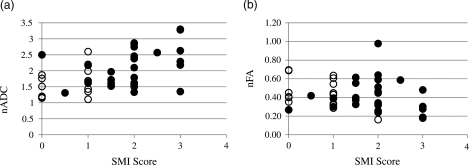
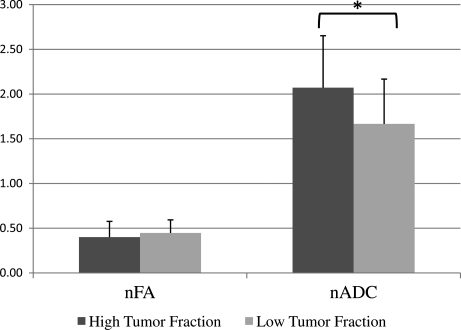
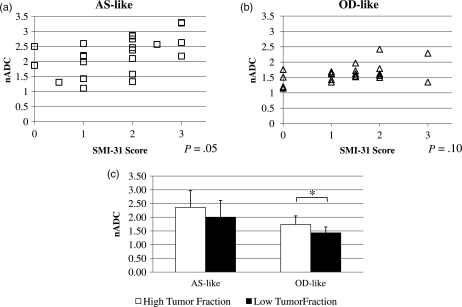
The apparent diffusion coefficient (ADC) determined from MR diffusion tensor imaging (DTI) has shown promise for distinguishing World Health Organization grade II astrocytoma (AS) from the more prognostically favorable grade II oligodendroglioma (OD). Since mixed oligoastrocytomas (OAs) with codeletions in chromosomes 1p and 19q confer prognoses similar to those of OD, we questioned whether a previously determined ADC-based criterion for distinguishing OD and AS would hold on an independent set of gliomas that included OA with codeleted or intact 1p/19q chromosomes. We also questioned whether the ADC is associated with the tumor microstructure. ADC colormaps generated from presurgical DTI scans were used to guide the collection of biopsies from each tumor. The median normalized ADC distinguished OD from AS with 91% sensitivity and 92% specificity. 1p/19q codeleted OAs were always classified as ODs, while 1p/19q intact OAs were always classified as ASs. There were positive associations between the ADC and both the SMI-31 score of axonal disruption and the fraction of tumor cells in the biopsies. The ADC of OD and 1p/19q codeleted OA was more associated with tumor fraction, while the ADC of AS and 1p/19q intact OA was more associated with SMI-31 score. We conclude that our previously determined threshold median ADC can distinguish grade II OD and AS on a new patient cohort and that the distinctions extend to OA with codeleted and intact 1p/19q chromosomes. Further, the ADC in grade II gliomas is associated with the fraction of tumor cells and degree of axonal disruption in tumor subregions.
Figures
Similar articles
-
Predicting 1p/19q codeletion status using diffusion-, susceptibility-, perfusion-weighted, and conventional MRI in IDH-mutant lower-grade gliomas.Acta Radiol. 2021 Dec;62(12):1657-1665. doi: 10.1177/0284185120973624. Epub 2020 Nov 22. Acta Radiol. 2021. PMID: 33222488
-
Codeletions at 1p and 19q predict a lower risk of pseudoprogression in oligodendrogliomas and mixed oligoastrocytomas.Neuro Oncol. 2014 Jan;16(1):123-30. doi: 10.1093/neuonc/not142. Epub 2013 Nov 26. Neuro Oncol. 2014. PMID: 24285548 Free PMC article.
-
Fluorescence in situ hybridization for 1p, 19q status in a cohort of glial neoplasms.Neurol India. 2014 Jan-Feb;62(1):32-6. doi: 10.4103/0028-3886.128275. Neurol India. 2014. PMID: 24608451
-
A review of adult-type diffuse gliomas in the WHO CNS5 classification with special reference to Astrocytoma, IDH-mutant and Oligodendroglioma, IDH-mutant and 1p/19q codeleted.Indian J Pathol Microbiol. 2022 May;65(Supplement):S14-S23. doi: 10.4103/ijpm.ijpm_34_22. Indian J Pathol Microbiol. 2022. PMID: 35562130 Review.
-
Clinicopathologic aspects of 1p/19q loss and the diagnosis of oligodendroglioma.Arch Pathol Lab Med. 2007 Feb;131(2):242-51. doi: 10.5858/2007-131-242-CAOQLA. Arch Pathol Lab Med. 2007. PMID: 17284109 Review.
Cited by
-
Noninvasive Assessment of IDH Mutational Status in World Health Organization Grade II and III Astrocytomas Using DWI and DSC-PWI Combined with Conventional MR Imaging.AJNR Am J Neuroradiol. 2017 Jun;38(6):1138-1144. doi: 10.3174/ajnr.A5171. Epub 2017 Apr 27. AJNR Am J Neuroradiol. 2017. PMID: 28450436 Free PMC article.
-
Can diffusion tensor imaging noninvasively detect IDH1 gene mutations in astrogliomas? A retrospective study of 112 cases.AJNR Am J Neuroradiol. 2014 May;35(5):920-7. doi: 10.3174/ajnr.A3803. Epub 2014 Feb 20. AJNR Am J Neuroradiol. 2014. PMID: 24557705 Free PMC article.
-
Regional variation in histopathologic features of tumor specimens from treatment-naive glioblastoma correlates with anatomic and physiologic MR Imaging.Neuro Oncol. 2012 Jul;14(7):942-54. doi: 10.1093/neuonc/nos128. Epub 2012 Jun 18. Neuro Oncol. 2012. PMID: 22711606 Free PMC article.
-
Predicting Genotype and Survival in Glioma Using Standard Clinical MR Imaging Apparent Diffusion Coefficient Images: A Pilot Study from The Cancer Genome Atlas.AJNR Am J Neuroradiol. 2018 Oct;39(10):1814-1820. doi: 10.3174/ajnr.A5794. Epub 2018 Sep 6. AJNR Am J Neuroradiol. 2018. PMID: 30190259 Free PMC article.
-
Whole-Tumor Histogram and Texture Analyses of DTI for Evaluation of IDH1-Mutation and 1p/19q-Codeletion Status in World Health Organization Grade II Gliomas.AJNR Am J Neuroradiol. 2018 Apr;39(4):693-698. doi: 10.3174/ajnr.A5569. Epub 2018 Mar 8. AJNR Am J Neuroradiol. 2018. PMID: 29519794 Free PMC article.
References
-
- Olson JD, Riedel E, DeAngelis LM. Long-term outcome of low-grade oligodendroglioma and mixed glioma. Neurology. 2000;54(7):1442–1448. - PubMed
-
- Shaw EG, Scheithauer BW, O'Fallon JR, Tazelaar HD, Davis DH. Oligodendrogliomas: the Mayo Clinic experience. J Neurosurg. 1992;76(3):428–434. doi:10.3171/jns.1992.76.3.0428. - DOI - PubMed
-
- Fortin D, Macdonald DR, Stitt L, Cairncross JG. PCV for oligodendroglial tumors: in search of prognostic factors for response and survival. Can J Neurol Sc. 2001;28(3):215–223. - PubMed
-
- Glass J, Hochberg FH, Gruber ML, Louis DN, Smith D, Rattner B. The treatment of oligodendrogliomas and mixed oligodendroglioma-astrocytomas with PCV chemotherapy. Journal of Neurosurgery. 1992;76(5):741–745. doi:10.3171/jns.1992.76.5.0741. - DOI - PubMed
-
- Kitange GJ, Smith JS, Jenkins RB. Genetic alterations and chemotherapeutic response in human diffuse gliomas. Expert Rev Anticancer Ther. 2001;1(4):595–605. doi:10.1586/14737140.1.4.595. - DOI - PubMed
Publication types
MeSH terms
Grants and funding
LinkOut - more resources
Full Text Sources
Medical
Research Materials
Miscellaneous
