. 2011 Oct;49(10):3584-90.
doi: 10.1128/JCM.00970-11. Epub 2011 Aug 24.

Rapid multiplexed immunoassay for simultaneous serodiagnosis of HIV-1 and coinfections

Affiliations

Rapid multiplexed immunoassay for simultaneous serodiagnosis of HIV-1 and coinfections

Michael J Lochhead et al. J Clin Microbiol. 2011 Oct.

Abstract

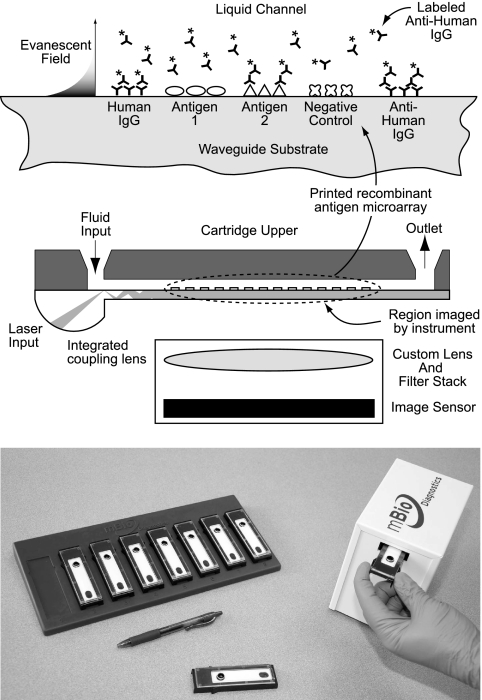
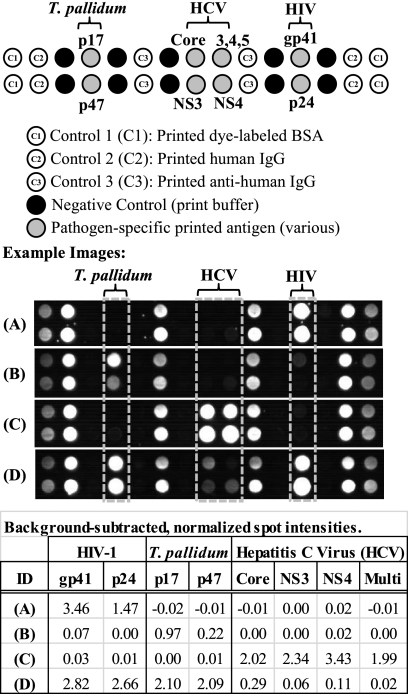
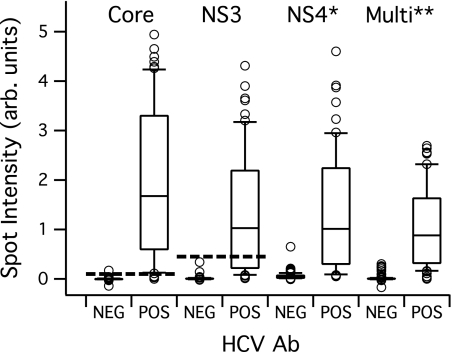
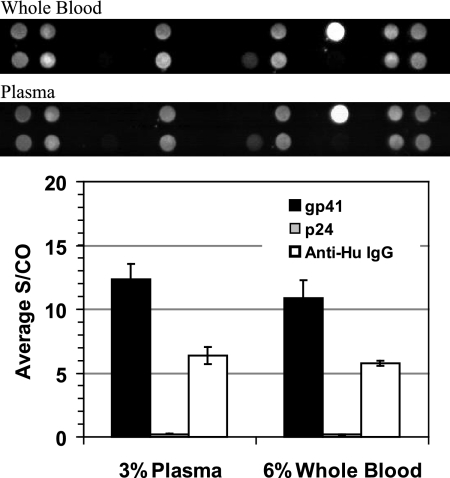
Diagnosis of opportunistic infections in HIV-infected individuals remains a major public health challenge, particularly in resource-limited settings. Here, we describe a rapid diagnostic system that delivers a panel of serologic immunoassay results using a single drop of blood, serum, or plasma. The system consists of disposable cartridges and a simple reader instrument, based on an innovative implementation of planar waveguide imaging technology. The cartridge incorporates a microarray of recombinant antigens and antibody controls in a fluidic channel, providing multiple parallel fluorescence immunoassay results for a single sample. This study demonstrates system performance by delivering antibody (Ab) reactivity results simultaneously for multiple antigens of HIV-1, Treponema pallidum (syphilis), and hepatitis C virus (HCV) in a collection of clinical serum, plasma, and whole-blood samples. By plotting antibody reactivity (fluorescence intensity) for known positive and negative samples, empirical reactivity cutoff values were defined. The HIV-1 assay shows 100% agreement with known seroreactivity for a collection of 82 HIV Ab-positive and 142 HIV Ab-negative samples, including multiple samples with HCV and syphilis coinfection. The treponema-specific syphilis assay correctly identifies 67 of 68 T. pallidum Ab-positive and 100 of 102 T. pallidum Ab-negative samples, and the HCV assay correctly identifies 59 of 60 HCV Ab-positive and 120 of 121 HCV Ab-negative samples. Multiplexed assay performance for whole-blood samples is also demonstrated. The ability to diagnose HIV and opportunistic infections simultaneously at the point of care should lead to more effective therapy decisions and improved linkage to care.


Figures

Fig. 1.
Fig. 1.
(Top) Schematic representation of the multiplexed fluorescence immunoassay and disposable assay cartridge. A protein microarray is printed to a plastic planar waveguide which is bonded to a plastic upper component to define a flow channel. Sample, wash, and detect reagents are introduced via a fluid inlet. Illumination of the assay surface is via the evanescent field generated down the length of the multimode waveguide. The array is imaged in a single field of view through the plane of the waveguide. (Bottom) MBio instrument and rack of assay cartridges.
Fig. 2.
Fig. 2.
Representative images and array layout for the multiplex HIV/syphilis/HCV assay. The 30-feature array (2 rows by 15 columns) includes pathogen-specific printed antigens as well as multiple in-assay controls. Dye-labeled BSA spots serve as corner markers (C1) for imaging. These spots are not used in the analysis. Printed human IgG (C2) serves as a control for the dye-labeled detect antibody. Printed anti-human IgG (C3) serves as a sample control. Print buffer spots serve as a nonspecific binding negative control. Images from four clinical plasma samples are shown, along with background-subtracted spot intensities for the pathogen-specific antigens. Based on reference test methods, samples A to C are each monoinfected, with reactivity to HIV Ab (A), T. pallidum Ab (B), and HCV Ab (C). Sample D has Ab reactivity to all three pathogens by both the reference methods and the MBio assay. See the text for additional details.
Fig. 3.
Fig. 3.
Antibody reactivity in the MBio system for clinical samples with known HIV-1 and T. pallidum serostatus. Spot intensity is the background-subtracted, normalized intensity described in the text. Antibody reactivity against all antigens in Fig. 3 and 4 is measured simultaneously for each sample. The horizontal solid bar in each box represents the median; upper and lower boundaries of the boxes are the 75th and 25th percentiles; and the upper and lower whisker bars are the 90th and 10th percentiles, respectively. The open circles represent samples with values above and below the 90th and 10th percentiles. The dashed lines are empirically derived cutoffs. (a) Antibody reactivity results for a total of 224 samples with known HIV-1 Ab reactivity status (82 positive and 142 negative). (b) Antibody reactivity results for a total of 170 samples with known treponemal Ab reactivity status (68 positive and 102 negative). arb. units, arbitrary units; NEG, negative; POS, positive.
Fig. 4.
Fig. 4.
Antibody reactivity in the MBio assay for 181 clinical samples with known HCV antibody serostatus (60 positive and 121 negative). Spot intensity is the background-subtracted, normalized intensity described in the text. Antibody reactivity against all antigens is measured simultaneously for each sample. Box plot details are as described in the legend to Fig. 3. The dashed lines are empirically derived cutoffs for the core and NS3 recombinant antigens. The synthetic NS4* and Multi** multiple-epitope antigens showed relatively high signals on the HCV Ab negative samples, so cutoffs for these two antigens were not used in subsequent analyses.
Fig. 5.
Fig. 5.
Comparison of whole blood and plasma results performed with the MBio system. Cartridges were processed with 6% whole blood or 3% plasma from the same venipuncture sample approximately 24 h after draw. The larger volume of whole blood was to approximately compensate for cell volume. The array layout was as in Fig. 2. Images for the whole blood and plasma from this HIV-positive sample were essentially identical, demonstrating that there is no cellular or hemoglobin-induced interference in the system. The bar graph provides quantitative output for the gp41, p24, and anti-human IgG spots on the arrays. Note that the anti-human IgG is printed at a very low concentration in the array, with activity tuned to give signal on the same scale as that of positive antigen spots. Total IgG is in large excess in the sample. Data presented are mean values for three replicate cartridges for each sample type. Error bars represent one standard deviation. See the text for a detailed discussion.

Similar articles

Cited by

References

    1. Aach R. D., et al. 1991. Hepatitis C virus infection in post-transfusion hepatitis: an analysis with first- and second-generation assays. N. Engl. J. Med. 325:1325–1329 - PubMed
    1. Allain J.-P. 1998. The status of hepatitis C virus screening. Transfus. Med. Rev. 12:46–55 - PubMed
    1. Anderson D. A., Crowe S. M., Garcia M. 2011. Point-of-care testing. Curr. HIV/AIDS Rep. 8:31–37 - PubMed
    1. Chamot E., et al. 1990. Loss of antibodies against hepatitis C virus in HIV-seropositive intravenous drug users. AIDS 4:1275–1277 - PubMed
    1. Chien D. Y., et al. 1992. Diagnosis of hepatitis C virus (HCV) infection using an immunodominant chimeric polyprotein to capture circulating antibodies: reevaluation of the role of HCV in liver disease. Proc. Natl. Acad. Sci. U. S. A. 89:10011–10015 - PMC - PubMed

Publication types