

Competitive enzymatic interactions determine the relative amounts of prostaglandins E2 and D2
- PMID: 21865441
- PMCID: PMC3199988
- DOI: 10.1124/jpet.111.185405
Competitive enzymatic interactions determine the relative amounts of prostaglandins E2 and D2
Abstract
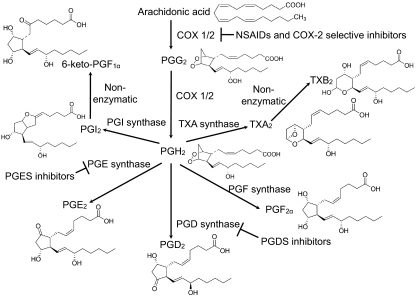
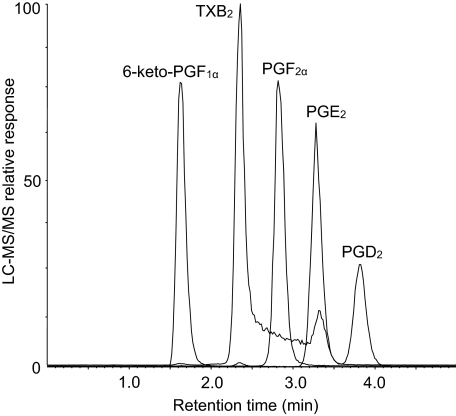
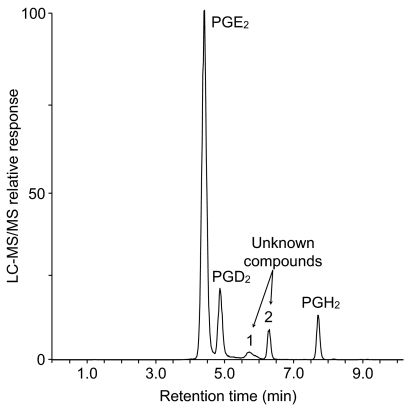
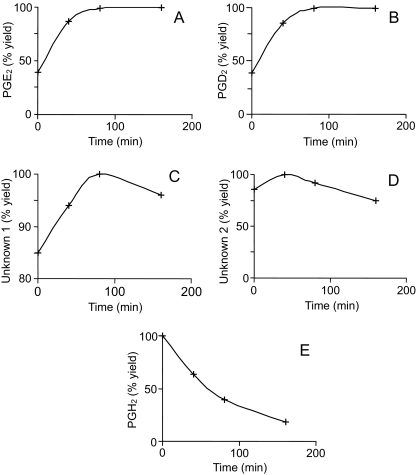
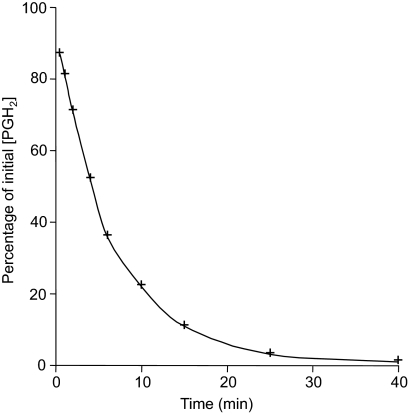
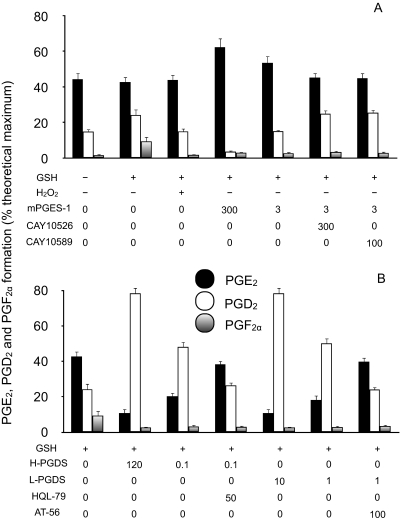
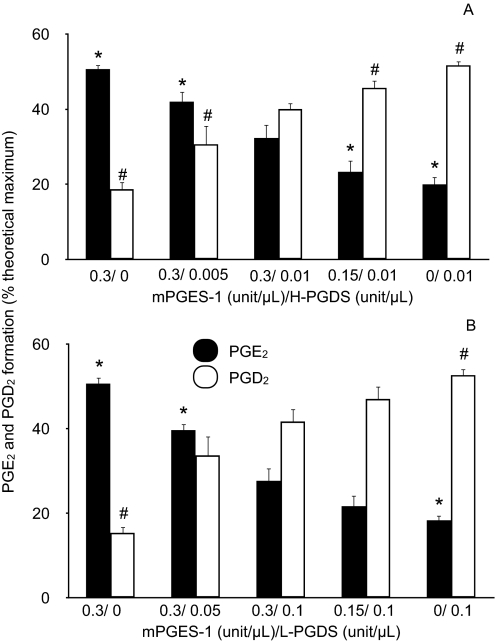
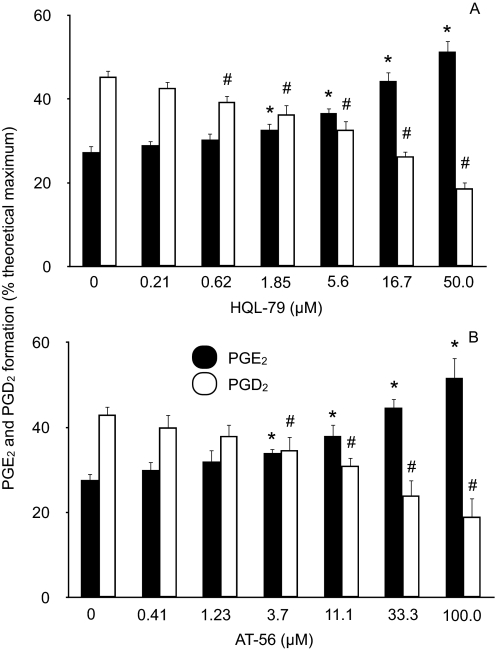
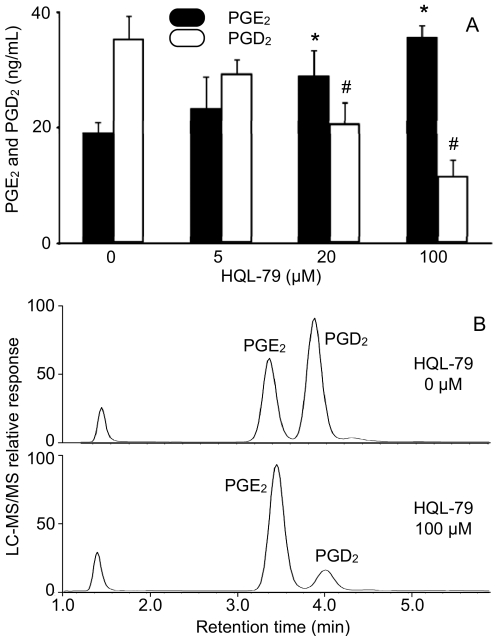
Prostaglandins (PGs) are a family of cellular messengers exerting diverse homeostatic and pathophysiologic effects. Recently, several studies reported significant increases of PGI(2) and PGF(2α) after the inhibition of microsomal PGE synthase-1 (mPGES-1) expression, which indicated that PGH(2) metabolism might be redistributed when the PGE(2) pathway is blocked. To address the determinants that govern the relative amounts of PGs, we developed an in vitro cell-free method, based on liquid chromatography-tandem mass spectrometry, to measure the exact amounts of these PGs formed in response to the addition of recombinant isomerases and their selective inhibitors. Our in vitro cell-free assay results were confirmed in cells using bone marrow-derived macrophage. Initially, we determined the in vitro stability of PGH(2) and noted that there was spontaneous nonenzymatic conversion to PGD(2) and PGE(2). mPGES-1 markedly increased the conversion to PGE(2) and decreased conversion to PGD(2). Reciprocally, the addition of hematopoietic or lipocalin PGD synthase resulted in a relative increase of PGD(2) and decrease of PGE(2). A detailed titration study showed that the ratio of PGE(2)/PGD(2) was closely correlated with the ratio of PGE synthase/PGD synthase. Our redistribution results also provide the foundation for understanding how PGH(2) metabolism is redistributed by the presence of distal isomerases or by blocking the major metabolic outlet, which could determine the relative benefits and risks resulting from interdiction in nonrated-limiting components of PG synthesis pathways.
Figures

Similar articles
-
Lipopolysaccharide-induced expression of microsomal prostaglandin E synthase-1 mediates late-phase PGE2 production in bone marrow derived macrophages.PLoS One. 2012;7(11):e50244. doi: 10.1371/journal.pone.0050244. Epub 2012 Nov 30. PLoS One. 2012. PMID: 23226252 Free PMC article.
-
Biochemical, functional, and pharmacological characterization of AT-56, an orally active and selective inhibitor of lipocalin-type prostaglandin D synthase.J Biol Chem. 2009 Mar 20;284(12):7623-30. doi: 10.1074/jbc.M808593200. Epub 2009 Jan 8. J Biol Chem. 2009. PMID: 19131342 Free PMC article.
-
Lipopolysaccharide induces macrophage migration via prostaglandin D(2) and prostaglandin E(2).J Pharmacol Exp Ther. 2008 Aug;326(2):493-501. doi: 10.1124/jpet.108.137992. Epub 2008 May 20. J Pharmacol Exp Ther. 2008. PMID: 18492946
-
Membrane prostaglandin E synthase-1: a novel therapeutic target.Pharmacol Rev. 2007 Sep;59(3):207-24. doi: 10.1124/pr.59.3.1. Pharmacol Rev. 2007. PMID: 17878511 Review.
-
PGE synthase inhibitors as an alternative to COX-2 inhibitors.Curr Opin Investig Drugs. 2007 May;8(5):411-5. Curr Opin Investig Drugs. 2007. PMID: 17520870 Review.
Cited by
-
Therapeutic Potential of Hematopoietic Prostaglandin D2 Synthase in Allergic Inflammation.Cells. 2019 Jun 20;8(6):619. doi: 10.3390/cells8060619. Cells. 2019. PMID: 31226822 Free PMC article. Review.
-
Method development and validation for ultra-high pressure liquid chromatography/tandem mass spectrometry determination of multiple prostanoids in biological samples.J AOAC Int. 2013 Jan-Feb;96(1):67-76. doi: 10.5740/jaoacint.12-280. J AOAC Int. 2013. PMID: 23513960 Free PMC article.
-
Microsomal PGE2 synthase-1 regulates melanoma cell survival and associates with melanoma disease progression.Pigment Cell Melanoma Res. 2016 May;29(3):297-308. doi: 10.1111/pcmr.12455. Epub 2016 Mar 15. Pigment Cell Melanoma Res. 2016. PMID: 26801201 Free PMC article.
-
Lipopolysaccharide-induced expression of microsomal prostaglandin E synthase-1 mediates late-phase PGE2 production in bone marrow derived macrophages.PLoS One. 2012;7(11):e50244. doi: 10.1371/journal.pone.0050244. Epub 2012 Nov 30. PLoS One. 2012. PMID: 23226252 Free PMC article.
-
Flaxseed enriched diet-mediated reduction in ovarian cancer severity is correlated to the reduction of prostaglandin E(2) in laying hen ovaries.Prostaglandins Leukot Essent Fatty Acids. 2013 Sep;89(4):179-87. doi: 10.1016/j.plefa.2013.08.001. Epub 2013 Aug 14. Prostaglandins Leukot Essent Fatty Acids. 2013. PMID: 23978451 Free PMC article. Clinical Trial.
References
-
- Bombardier C, Laine L, Reicin A, Shapiro D, Burgos-Vargas R, Davis B, Day R, Ferraz MB, Hawkey CJ, Hochberg MC, et al. (2000) Comparison of upper gastrointestinal toxicity of rofecoxib and naproxen in patients with rheumatoid arthritis. VIGOR Study Group. N Engl J Med 343:1520–1528 - PubMed
-
- Boutaud O, Brame CJ, Salomon RG, Roberts LJ, 2nd, Oates JA. (1999) Characterization of the lysyl adducts formed from prostaglandin H2 via the levuglandin pathway. Biochemistry 38:9389–9396 - PubMed
-
- Burgess JR, Yang H, Chang M, Rao MK, Tu CP, Reddy CC. (1987) Enzymatic transformation of PGH2 to PGF2α catalyzed by glutathione S-transferases. Biochem Biophys Res Commun 142:441–447 - PubMed
Publication types
MeSH terms
Substances
Grants and funding
LinkOut - more resources
Full Text Sources
Miscellaneous
