. 2011 Aug 24;31(34):12180-8.
doi: 10.1523/JNEUROSCI.1377-11.2011.

Counting ion and water molecules in a streaming file through the open-filter structure of the K channel

Affiliations

Counting ion and water molecules in a streaming file through the open-filter structure of the K channel

Masayuki Iwamoto et al. J Neurosci. .

Abstract

The mechanisms underlying the selective permeation of ions through channel molecules are a fundamental issue related to understanding how neurons exert their functions. The "knock-on" mechanism, in which multiple ions in the selectivity filter are hit by an incoming ion, is one of the leading concepts. This mechanism has been supported by crystallographic studies that demonstrated ion distribution in the structure of the Streptomyces lividans (KcsA) potassium channel. These still pictures under equilibrium conditions, however, do not provide a snapshot of the actual, ongoing permeation processes. To understand the dynamics of permeation, we determined the ratio of the ion and water flow [the water-ion coupling ratio (CR(w-i))] through the KcsA channel by measuring the streaming potential (V(stream)) electrophysiologically. The V(stream) value was converted to the CR(w-i) value, which reveals how individual ion and water molecules are queued in the narrow and short filter during permeation. At high K(+) concentrations, the CR(w-i) value was 1.0, indicating that turnover between the alternating ion and water arrays occurs in a single-file manner. At low K(+), the CR(w-i) value was increased to a point over 2.2, suggesting that the filter contained mostly one ion at a time. These average behaviors of permeation were kinetically analyzed for a more detailed understanding of the permeation process. Here, we envisioned the permeation as queues of ion and water molecules and sequential transitions between different patterns of arrays. Under physiological conditions, we predicted that the knock-on mechanism may not be predominant.


Figures
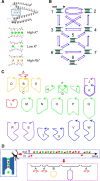
Figure 1.
Figure 1.
Permeation processes through the KcsA channel. A, The equilibrium ion distribution in the crystal structure of the KcsA channel. The selectivity filter (the boxed region in the top panel) is enlarged in the bottom under the different ionic conditions (Protein Data Bank accession codes: 1k4c, 1k4d, and 1r3i). There are four ion-binding sites in the selectivity filter, and the binding sites are named S1 to S4 from the outside (left) to the inside. The filter structure collapses at a low K+ concentration. Even at a high concentration of Rb+, the S2 site is left unoccupied. B, The discrete-state permeation model for the KcsA channel. The model involves eight K+ (green)-water (red) occupied states (diagrams with the state number; the left side is the extracellular space) in the selectivity filter and the transitions among them (arrows). The blue arrows indicate the transitions for efflux, and the violet ones indicate influx. C, The cyclic paths on the permeation diagram. For example, cycle A represents the transition between state 1 and 2, and cycle F represents the transition in states 3, 4, and 5. There are 23 cyclic paths for ion flux (alphabetical characters). They all involve two one-way cyclic paths with opposite directions. The arrows indicate the cycle direction for efflux (defined as + cycles). The cyclic paths are color coded to represent the water-ion coupling ratio. The red cycles indicate a 1:1 (water/ion) flux ratio; yellow, a 3:2 ratio; green, a 2:1 ratio; violet, a 5:2 ratio; and blue, a 4:1 ratio. D, A queue of ion and water flux and cycles on the diagram. From the observed queue of ion and water molecules, the demon assigns the queue to a series of cycles. Thus, ion and water flux can be regarded as random transitions among the cycles.
Figure 2.
Figure 2.
A discrete-state permeation diagram and the expanded diagram for the KcsA channel. A, The permeation diagram used in this study with the name of the rate constants. This model involves cycles having different nw-i values. B, The expanded diagram. The expanded diagram was constructed by defining state 3 as the starting state and all the states, except for state 3, were subdivided into substates, such as substate 8c. These diagrams include all of the 46 cyclic paths with one-way directionality. The arrows indicate the completing transitions for the one-way cycles, in which the solid arrows represent those of cycles generating the net cycle flux, and the cycle names are indicated with the + or − sign. The broken arrows indicate cycles of no net cycle flux. From the diagram, the one-way cycle fluxes for all the cyclic paths are readily calculated using matrix algebra.
Figure 3.
Figure 3.
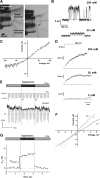
Measurements of the KcsA currents and the streaming potential. A, The osmotic pulse method. The configuration of the perfusion tubes and electrodes is shown. The outflow from each tube is different in osmolality. Rapid positional shifts of the tube lead to osmotic jumps within a few ms. The patch was stable even as it endured a 3 osmolar gradient (ΔOsm) across the membrane. B, The single-channel current of the KcsA channel for different K+ concentrations at pH 4.0. The current was measured at +100 mV. C, The single-channel current–voltage curve. A ramp voltage from −100 to +100 mV was applied during the open and closed states, and the difference in current was drawn. D, The macroscopic current upon voltage steps from 0 to +100 mV. The KcsA channel exhibits slow activation at positive potentials, and the time course of the activation differs significantly at different K+ concentrations. E, The protocol and evaluation of the Vrev. A train of the ramp voltage (+50 to −50 mV) was applied before, during, and after the osmotic pulse. A representative current trace elicited by a train of ramp commands synchronized with an osmotic pulse (in this case, 2.0 Osm/kg H2O) is shown in symmetric 200 mm K+ at pH 4.0. A slight reduction in current amplitudes was observed during exposure to the hyperosmotic solution. This reduction appears to occur at the access resistance, which was augmented by a hyperosmotic solution with a higher resistivity (Kuno et al., 2009). F, The shifts of the I–V curves during the time course of the osmotic pulse. The I–V curves were drawn from the ramp current. The numbers on the I–V curves represent the number of the ramp commands. Vrev was obtained by linear regression of the I–V curves. G, A typical time course of Vrev during the command train. Osmotically driven water flux across the membrane toward the outside of the pipette leads to the condensation of K+ at the inner surface of the patch membrane, which generates a gradual positive shift in Vrev during the hyperosmotic period.
Figure 4.
Figure 4.
The streaming potential of the KcsA channel. ΔOsm dependency of the Vstream under various ionic conditions. From the slope, the CRw-i value was calculated. A–D, The slope values were 0.45 ± 0.03 mV/ΔOsm for 200 mm K+ (A), 0.94 ± 0.09 mV/ΔOsm for 200 mm Rb+ (B), and 0.82 ± 0.05 and 1.01 ± 0.07 mV/ΔOsm in 20 mm K+ (C) and 3 mm K+ (D). The data represent the mean slope value ± the error of the slope.
Figure 5.
Figure 5.
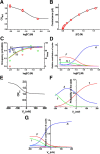
Experimental data and the underlying permeation processes. A, B, The experimental data of CRw-i (A) and the conductance (B) as a function of the K+ concentration. The rate constants of the eight state permeation model were optimized to fit these experimental data. The lines indicate the fitted lines calculated from the cycle flux. C, The K+ occupancy on the four binding sites in the selectivity filter as a function of the K+ concentration. The ion distribution data of the crystal structure are represented as the area of the electron density (circles) superimposed through an appropriate scaling. Black (the symbols and the lines) indicates the S1 site, red indicates the S2 site, green indicates the S3 site, and blue indicates the S4 site. D, The current contributions from each cycle. The optimized rate constants were as follows (/s): k1 = 5.0 × 10⁷, k3 = 1.5 × 10⁸, k5 = 2.5 × 10⁵, k7 = 8.0 × 10⁸, k9 = 3.5 × 10⁸, k11 = 3.6 × 10¹⁰, k13 = 1.0 × 10⁹, k15 = 1.8 × 10¹⁰, k17 = 1.8 × 10⁹, k19 = 4.0 × 10⁸, k21 = 1.44 × 10⁷, k25 = 2.0 × 10⁶, and k27 = 2.0 × 10⁹. E–G, The predicted features of permeation in an asymmetric condition of 4 mm Kout and 150 mm Kin at different membrane potentials; predicted curves for CRw-i (E), the probability of the states (F), and the relative contributions of the cycles at different membrane potentials (G).
Figure 6.
Figure 6.
The visualized permeation processes. A, The relative contributions of the cycles at different K+ concentrations. The eight state diagram is shown as the footprint, above which the cyclic paths predominantly used in the permeation are demonstrated (the dark blue diamond for cycle A, the red triangle for cycle F, the light blue triangle for cycle H, the green triangle for cycle I, and the blue escutcheon for cycle K). The relative contributions of cycles are expressed as the level of height raised from the footprint. Cycles contributing to the net flux <0.01 are not shown. At 200 mm, the relative contribution of cycle A was 0.83, and that of cycle F was 0.15; at 20 mm, that of cycle A was 0.29, cycle F was 0.42, cycle G was 0.03, and cycles H and I were 0.11; and at 3 mm, that of cycle A was 0.04, cycle F was 0.34, cycle G was 0.09, cycles H and I were 0.18, cycle K was 0.13, and cycle L was 0.03. B, Predicted relative contributions of cycles at different membrane potentials in an asymmetric condition of 4 mm Kout and 150 mm Kin. At 0 mV, the relative contribution of cycle A was 0.62, cycle F was 0.22, cycle H was 0.01, cycle I was 0.11, and cycle L was 0.02; at −100 mV, that of cycle A was 0.34, cycle F was 0.38, cycle G was 0.02, cycle H was 0.03, cycle I was 0.22, and cycle L was 0.02.

Similar articles

Cited by

References

    1. Alcayaga C, Cecchi X, Alvarez O, Latorre R. Streaming potential measurements in Ca2+-activated K+ channels from skeletal and smooth muscle. Coupling of ion and water fluxes. Biophys J. 1989;55:367–371. - PMC - PubMed
    1. Ando H, Kuno M, Shimizu H, Muramatsu I, Oiki S. Coupled K+-water flux through the HERG potassium channel measured by an osmotic pulse method. J Gen Physiol. 2005;126:529–538. - PMC - PubMed
    1. Bernèche S, Roux B. Energetics of ion conduction through the K+ channel. Nature. 2001;414:73–77. - PubMed
    1. Chakrapani S, Cordero-Morales JF, Perozo E. A quantitative description of KcsA gating I: macroscopic currents. J Gen Physiol. 2007;130:465–478. - PMC - PubMed
    1. Colquhoun D, Hawkes AG. The principles of the stochastic interpretation of ion-channel mechanisms. In: Sakmann B, Neher E, editors. Single-channel recording. 2nd Ed. New York: Plenum; 1995. pp. 397–482.

Publication types

MeSH terms