Comparative Study
. 2011 Aug 24;31(34):12270-81.
doi: 10.1523/JNEUROSCI.1671-11.2011.

Memory-guided learning: CA1 and CA3 neuronal ensembles differentially encode the commonalities and differences between situations

Affiliations
Comparative Study

Memory-guided learning: CA1 and CA3 neuronal ensembles differentially encode the commonalities and differences between situations

Amir S Bahar et al. J Neurosci. .

Abstract

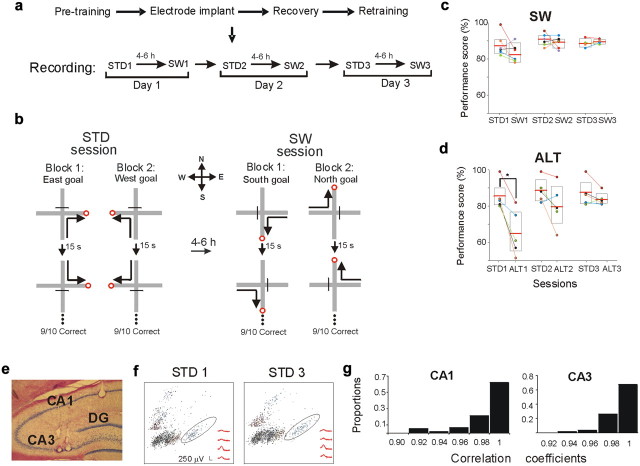
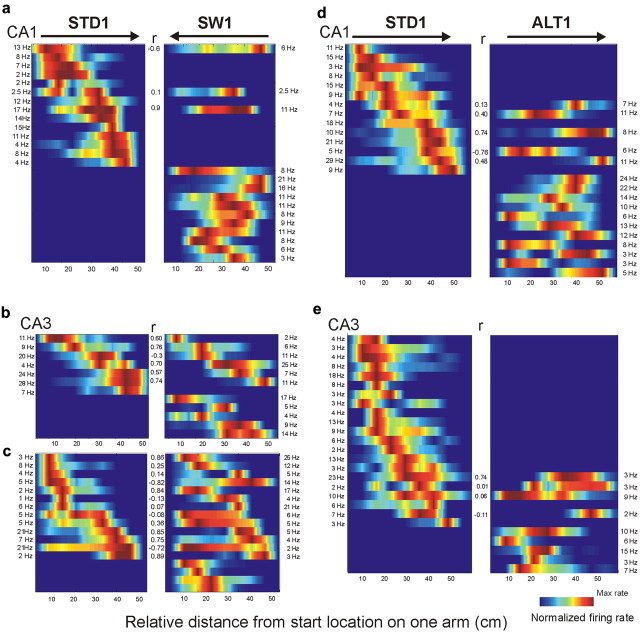
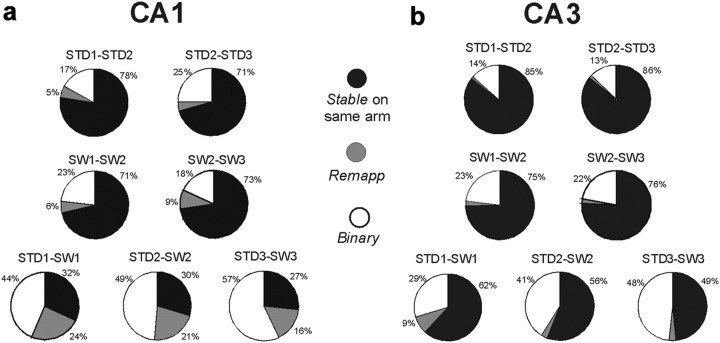
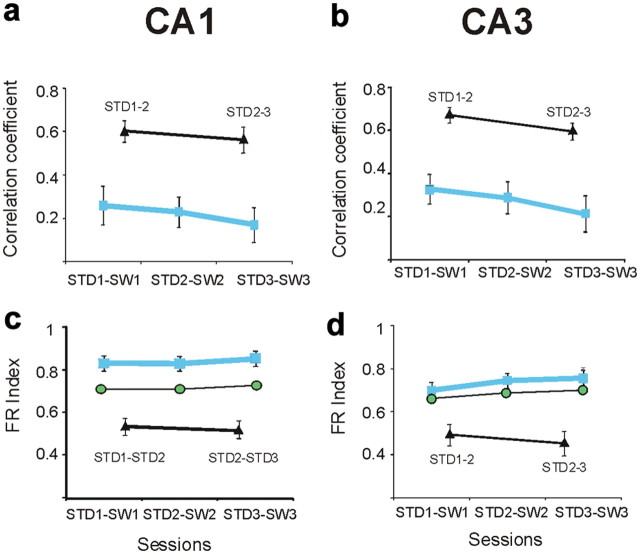
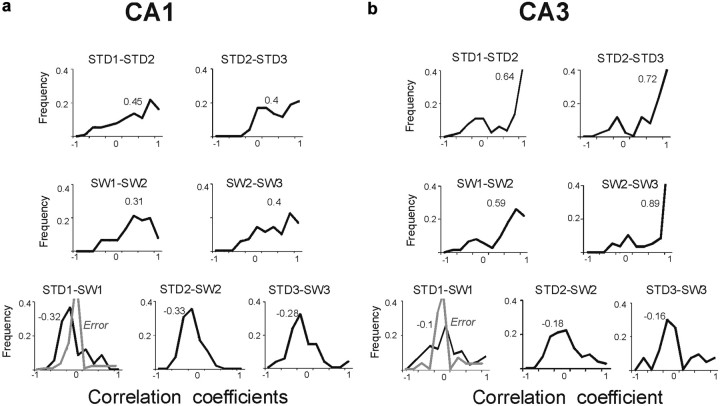
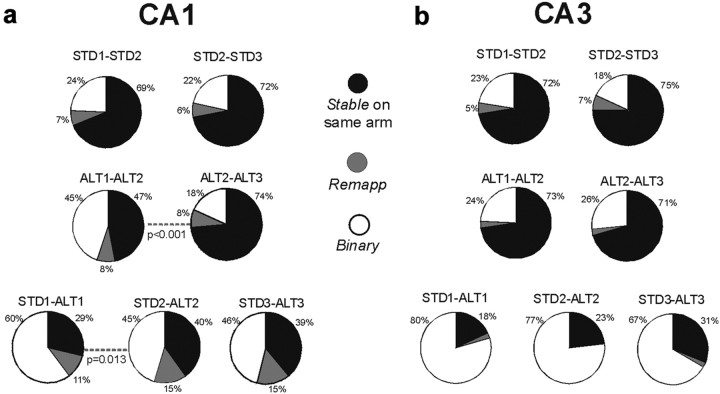
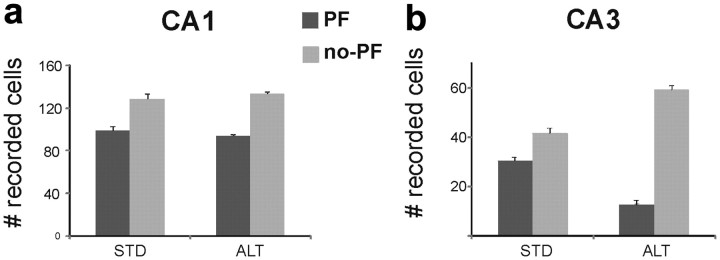
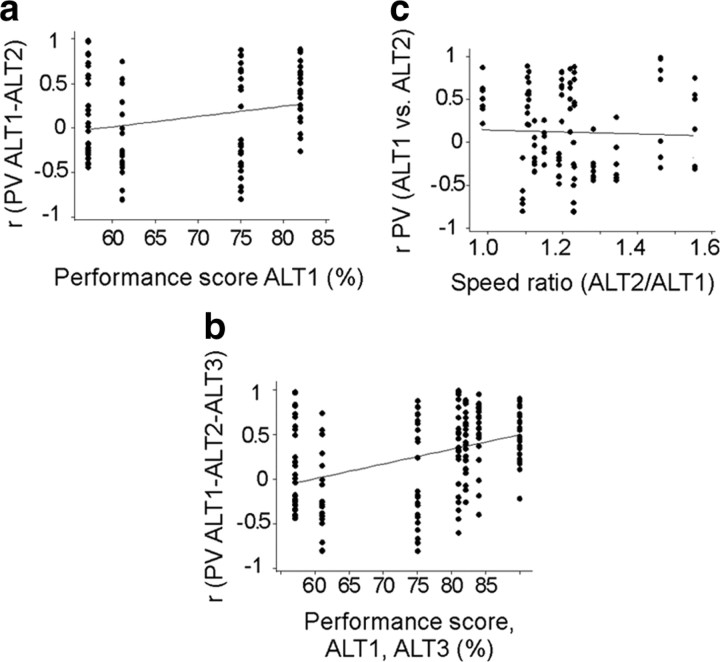
Memory influences learning, but how neural signals support such transfer are unknown. To investigate these mechanisms, we trained rats to perform a standard spatial memory task in a plus maze and tested how training affected learning and neural coding in two new task variants. A switch task exchanged the start and goal locations in the same environment, whereas, an altered environment task contained unfamiliar local and distal cues. Learning was facilitated in both variants compared with the acquisition of the standard task. In the switch task, performance was largely maintained, and was accompanied by immediate and stable place-field remapping. Place-field maps in CA1 were anticorrelated in the standard and switch sessions, and the anticorrelation covaried with switch performance. Simultaneously, CA3 maps were uncorrelated overall in the standard and switch, though many CA3 cells had fields in shifted locations in the same maze arms. In the altered environment, performance was initially impaired, and place fields changed dynamically. CA1 fields were initially unstable, and their stabilization correlated with improving performance. Most CA3 cells, however, stopped firing on the maze in the altered environment, even as the same cells maintained prominent fields in standard sessions recorded before and after. CA1 and CA3 place fields thus revealed different coding dynamics that correlated with both learning and memory performance. Together, CA1 and CA3 ensembles represented the similarities and differences between new and familiar situations through concurrent rate and place remapping.


Figures

Figure 1.
Figure 1.
Experimental design, performance, and recording stability. a, The recording protocols of the SW and ALT tasks (data not shown) were identical. b, Rats were trained in a spatial win-stay task with serial reversals on a plus maze. In the familiar STD session rats performed 10 trials of each of four possible journeys (north to west, south to west, north to east, and south to east). In the SW task, rats completed east to south, west to south, east to north, and west to north journeys using the same standard protocol. c, SW performance. Each color-coded circle represents the score of an individual rat. Boxes represent 95% confidence intervals. Horizontal lines are the mean. Lines connect scores of individuals between sessions. The SW task was learned to criterion in 11.5 trials (STD1 = 10 trials, p = 0.3; mean score: STD1 = 87%, SW1 = 83%, p = 0.2). d, During ALT1, mean performance decreased significantly, but recovered the next day (trials to criterion: ALT1 = 41, STD1 = 10, p = 0.005; mean score: STD1 = 85%, ALT1 = 65%, p = 0.02; STD2 = 88%, ALT2 = 80%, p = 0.2). e, The representative coronal section shows a simultaneous placement of tetrodes in CA1 and CA3. f, Cluster-waveform maps of CA1 cells recorded in the first and last STD session demonstrate the stability of recording location. The clusters surrounded by an ellipse contain the waveforms shown in the bottom right. g, Recording stability was further determined by calculating the correlation coefficient between the average waveforms recorded during the first and last recording sessions (see Materials and Methods). The graphs show the distribution of waveform correlation coefficients between all recorded cells, in CA1 and CA3, respectively. Waveforms were highly correlated (all r > 0.9), demonstrating high stability.
Figure 2.
Figure 2.
Firing-rate maps of CA1 and CA3 cells during STD, SW, and ALT tasks. Each panel shows the firing rates of simultaneously recorded neurons. The colored horizontal bars within a panel show the firing-rate distribution of an individual cell on one arm, sorted by the maximal firing rate during the STD. Parallel bars in adjacent panels show the activity of the same cells on the same arm in different tasks. Rate maps were smoothed for this figure only, not in statistical analyses. The color code depicts firing rate normalized to each cell's maximal firing rate. Blue areas on the maps represent 0 Hz. The maximal firing rate of each cell is listed at the edge of each panel; Pearson's r is shown in the center. Arrows on top indicate movement direction. a–c, The SW task. Firing-rate maps of CA1 (a) and CA3 (b, c) during STD1 (left panels) and SW1 sessions (right panels). a and b show simultaneous recordings in CA1 and CA3, respectively, from the same rat. c, CA3 cells recorded from a different rat during the SW session. Note the large CA3 subpopulation that remained active on the same arm between STD and SW. d, e, The ALT task. Firing-rate maps of active CA1 (d) and CA3 (e) cells during the STD1 (left) and ALT1 sessions (right). Most CA1 cells were active in a given arm in only one of the tasks. Few CA3 cells were active during the ALT task.
Figure 3.
Figure 3.
Place-field stability on the same arm between STD and SW sessions. a, b, Categorical analyses of CA1 (a) and CA3 (b) place fields. The pie charts show the distributions of response categories between session pairs (e.g., the STD1-STD2 pie chart in the first row compares between the first and second STD sessions). Response categories were as follows: Stable, cells that maintained a place field on the same arm between sessions; Remap, cells that had a place field in both sessions, but on different arms; Binary, cells that had a place field in only one of the compared sessions. Stable responses were common in both CA1 and CA3 in repeated STD and repeated SW sessions (>70%). Between STD and SW sessions (bottom row), place fields were significantly more stable on the same arm in CA3 compared with CA1. The levels of Stable response category in CA3 decreased between the first and last recording day (62–49%; χ2(1) = 5, p = 0.027).
Figure 4.
Figure 4.
Spatial and rate codes differed between STD and SW in both CA1 and CA3 cells. a, b, Spatial correlations of individual CA1 (a) and CA3 (b) cells between STD and SW sessions were significantly lower than the correlations computed for repeated STD sessions. The blue boxes indicate the mean correlations at different recording days between STD and SW sessions (labeled by the x-axes; error bars are SEM). The black triangles indicate the mean correlations between repeated STD sessions. The correlations between repeated SW sessions were not statistically distinguishable from repeated STD sessions (data not shown; p > 0.36). c, d, Firing-rate changes across sessions in individual cells were quantified by a firing-rate index (see Materials and Methods). A higher value indicated a higher rate change. c, In CA1, the average firing-rate changes were significantly greater between the STD and SW sessions (blue boxes) than between repeated STD sessions (black triangles), and were also greater than the rate changes expected by independent remapping (green circles; mean ± SEM, STD1-SW1: observed rate index = 0.83 ± 0.03, independent rate index = 0.71 ± 0.01, KS = 0.2, p < 0.01) (firing-rate index across rats: CA1 = 0.78, 0.75, 0.9). The average firing-rate indices expected by independent remapping were calculated after permuting the firing rates of individual cells in the SW session and calculating simulated firing-rate indices, see Materials and Methods (Leutgeb et al., 2004). d, In contrast to CA1, the average CA3 firing-rate changes between STD and SW were not different from the average rate changes expected by independent remapping (mean ± SEM, STD1-SW1: observed mean = 0.7 ± 0.04, simulated mean = 0.66 ± 0.01, KS = 0.07, p = 0.8) (firing-rate index across rats: CA3 = 0.57, 0.6, 0.7, 0.68, 0.7).
Figure 5.
Figure 5.
CA1 population vectors were anticorrelated between STD and SW, whereas CA3 vectors were uncorrelated. a, b, Population vector analyses for CA1 (a) and CA3 (b). The plots show the frequencies of population vector correlations between different sessions. Top row, between repeated STD sessions; middle row, between repeated SW sessions; lower row, between STD and SW sessions. The values above the distributions depict medians. Between STD and SW sessions, CA1 population vectors were more anticorrelated (median = −0.32), compared with CA3 population vectors (median = −0.1). Distributions of correlations during error trials (comparing error SW1 to correct STD1 trials) are marked in gray. In CA1, most correlations between error SW and correct STD trials became less anticorrelated (median was 0). Unlike CA1, CA3 population vector correlations did not distinguish correct from error trials (median correlations were 0 in correct or error trials).
Figure 6.
Figure 6.
Firing patterns across correct and error trials. During errors SW trials many CA1 and CA3 cells had lower firing rates compared with correct SW or STD trials (mean rate on an arm, Hz ± SEM, correct trials: STD1 = 2.7 ± 0.2, SW1 = 3 ± 0.2; errors = 0.9 ± 0.2, F(2, 1374) = 25, p < 0.0001, Tukey's post-test). Error trials were included in the analysis only if overt behavior (speed and direction) was consistent. The average speed was 4.5% lower in error trials compared with correct trials, and different speeds on the entire arms or within the firing fields were poorly correlated with different rates (r2 = 0.024; r2 = 0.01). a, b, Representative examples of spiking activity of CA1 (a) and CA3 (b) cells on different arms of the maze. The squares show grid units, gray dots show visits, and colored dots represent spikes. Four correct and four error trials in the SW task are shown. c, Color-coded firing-rate map showing population activity of CA1 cells during correct SW trials and error SW trials (activity was averaged across four trials). Firing rates were normalized for each cell across correct and error trials. The average firing rate of CA1 and CA3 cells did not decrease during errors in the ALT task (mean rate ± SEM, ALT: correct = 2.87 ± 0.2, error = 2.9 ± 0.3, t(524) = −0.09, p = 0.92).
Figure 7.
Figure 7.
Categorical analysis of hippocampal place fields in STD and ALT sessions. a, b, The pie charts show distribution of response categories between session pairs in CA1 (a), and CA3 (b) cells. Dotted lines indicate a statistically significant difference between a session pair. Stable responses were common in both CA1 and CA3 between repeated STD sessions. Stable responses were also common in CA3 cells between repeated ALT sessions, regardless of improved memory performance across these sessions. Two significant changes were observed between the first and second ALT sessions in CA1 fields: 47% were stable between the first and second ALT sessions, and the stability increased significantly in later sessions (see increased Stable category during ALT2-ALT3, second row). Twenty-nine percent of CA1 fields were stable between STD1 and ALT1 sessions, and the stability increased significantly in later STD and ALT comparisons (bottom row). In CA3, most cells had a place field in either STD or ALT, but not both (b, bottom row).
Figure 8.
Figure 8.
Spatial and rate codes differed between STD and ALT in both CA1 and CA3 cells. a, b, Spatial correlations of individual CA1 (a) and CA3 (b) cells between STD and ALT sessions were significantly lower than the correlations computed for repeated STD sessions. The blue boxes indicate the mean correlations at different recording days between STD and ALT sessions (labeled by the x-axes; error bars are SEM). Black triangles and red boxes indicate the mean correlations between repeated STD and ALT sessions, respectively. (mean Pearson's r between STD1 and ALT1 in individual rats: CA1 = 0, 0, 0.1, 0.01; CA3 = 0, 0.14, 0.1) c, d, Firing-rate changes across sessions in individual cells were quantified by a firing-rate index (see Materials and Methods). c, In CA1, the average firing-rate changes were significantly greater between the STD and ALT sessions than between repeated STD sessions, and were also greater than the rate changes expected by independent remapping (green circles; mean ± SEM, STD1-ALT1: observed firing-rate index = 0.86 ± 0.02, independent index: CA1 = 0.73 ± 0.01, KS = 0.21, p < 0.01) (mean firing-rate index between STD1 and ALT1 across individual rats: CA1 = 0.85, 0.86, 0.84, 0.9); CA3 = 0.72, 0.9, 0.84). Firing rates of CA1 cells were unstable between ALT1 and ALT2 sessions, as indicated by the high firing-rate index calculated between the ALT1 and ALT2 sessions. d, In contrast to CA1, CA3 firing-rate changes between STD and ALT were not different from the rate changes expected by independent remapping (mean ± SEM, STD1-ALT1: observed mean = 0.85 ± 0.05, independent index: CA3 = 0.77 ± 0.01, KS = 0.14, p = 0.8).
Figure 9.
Figure 9.
Population vector correlation analysis in STD and ALT sessions. a, b, Population vector analyses for CA1 (a) and CA3 (b). The plots show the frequencies of population vector correlations between different sessions. Most CA1 population vectors were anticorrelated between STD and ALT (median = −0.34), compared with population vectors in CA3 (median = 0) (median population vector correlation between STD1 and ALT1, individual rats: CA1 = −0.26, − 0.29, − 0.35, − 0.5; CA3 = 0, 0, − 0.13). In later sessions, many CA3 population vectors became anticorrelated as well (median r in STD2-ALT2: CA1 = −0.34, CA3 = −0.28, KS = 0.1, p > 0.05). Distributions of error trials in ALT1 are shown by gray lines. In CA1, the correlations between error ALT and correct STD trials remained anticorrelated (median was −0.21). CA3 population vector correlations did not distinguish correct from error trials. Consistent with the categorical and the firing-rate index analyses (Figs. 7, 8), correlations of population vectors were low between the ALT1 and ALT2 sessions, but increased significantly between the ALT2 and ALT3 sessions.
Figure 10.
Figure 10.
CA3 place fields were absent on the arms during the ALT task. a, b, The bar graphs show the average number of identified CA1 (a) and CA3 (b) cells across the 3 recording days for STD and ALT sessions. The number of cells that had a place field (PF) on at least one maze arm is shown by the dark gray bars; the numbers of cells that had no place field in any arm are in light gray. Cells were identified as spike clusters in recordings that included during the intertrial interval on the waiting platform and areas of the maze excluded from the analysis (e.g., during reward consumption). The proportions of CA1 cells with place fields on the arms (∼40%) were consistent in all STD and ALT recording sessions and were similar to prior studies. The number of CA3 cells with place fields declined significantly during all ALT sessions (place fields/total recorded cells across rats: 3/26, 3/25, 6/21 in ALT1; average ratio across ALT sessions: 0.17, 0.18, 0.18). The cells that had place fields in the STD but not the ALT (e.g., Fig. 2e) sometimes fired on the waiting platform. CA3 place fields tended to be larger during the ALT than the STD sessions, but the difference was not statistically significant (mean place field size, cm2 ± SD: STD1 = 118 ± 65, ALT1 = 151 ± 68). The proportions of CA1 and CA3 cells that had a place field were unchanged between STD and SW (data not shown).
Figure 11.
Figure 11.
Population vectors in CA1 stabilized as performance improved during repeated ALT sessions. a, Performance during ALT1 was predicted by the similarity of population vectors in ALT1 and ALT2 sessions. The correlation (r = 0.26, p = 0.015) suggests that better performance during the first ALT session was related to stable population vectors that were maintained the next day. Each column of symbols shows memory performance and population vector correlations for one rat. b, The association between performance and population coding stability appeared to strengthen in ALT3 sessions, when the population vector correlations among the three ALT sessions were included (r = 0.39, p < 0.0001). c, Differences in running speeds across ALT1 and ALT2 were unrelated to population vector correlations across the ALT sessions (r = 0, p = 0.7).

References

    1. Acsády L, Kamondi A, Sík A, Freund T, Buzsáki G. GABAergic cells are the major postsynaptic targets of mossy fibers in the rat hippocampus. J Neurosci. 1998;18:3386–3403. - PMC - PubMed
    1. Alvernhe A, Van Cauter T, Save E, Poucet B. Different CA1 and CA3 representations of novel routes in a shortcut situation. J Neurosci. 2008;28:7324–7333. - PMC - PubMed
    1. Alvernhe A, Save E, Poucet B. Local remapping of place cell firing in the Tolman detour task. Eur J Neurosci. 2011;33:1696–1705. - PubMed
    1. Amaral DG, Witter MP. The three-dimensional organization of the hippocampal formation: a review of anatomical data. Neuroscience. 1989;31:571–591. - PubMed
    1. Bartlett EC. London: Cambridge UP; 1932. Remembering. A study in experimental and social psychology.

Publication types