Comparative Study
. 2011 Aug 24;31(34):12339-50.
doi: 10.1523/JNEUROSCI.2039-11.2011.

Orientation selectivity of synaptic input to neurons in mouse and cat primary visual cortex

Affiliations
Comparative Study

Orientation selectivity of synaptic input to neurons in mouse and cat primary visual cortex

Andrew Y Y Tan et al. J Neurosci. .

Erratum in

  • J Neurosci. 2011 Oct 12;31(41):14832

Abstract

Primary visual cortex (V1) is the site at which orientation selectivity emerges in mammals: visual thalamus afferents to V1 respond equally to all stimulus orientations, whereas their target V1 neurons respond selectively to stimulus orientation. The emergence of orientation selectivity in V1 has long served as a model for investigating cortical computation. Recent evidence for orientation selectivity in mouse V1 opens cortical computation to dissection by genetic and imaging tools, but also raises two essential questions: (1) How does orientation selectivity in mouse V1 neurons compare with that in previously described species? (2) What is the synaptic basis for orientation selectivity in mouse V1? A comparison of orientation selectivity in mouse and in cat, where such measures have traditionally been made, reveals that orientation selectivity in mouse V1 is weaker than in cat V1, but that spike threshold plays a similar role in narrowing selectivity between membrane potential and spike rate. To uncover the synaptic basis for orientation selectivity, we made whole-cell recordings in vivo from mouse V1 neurons, comparing neuronal input selectivity-based on membrane potential, synaptic excitation, and synaptic inhibition-to output selectivity based on spiking. We found that a neuron's excitatory and inhibitory inputs are selective for the same stimulus orientations as is its membrane potential response, and that inhibitory selectivity is not broader than excitatory selectivity. Inhibition has different dynamics than excitation, adapting more rapidly. In neurons with temporally modulated responses, the timing of excitation and inhibition was different in mice and cats.


Figures
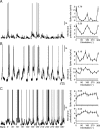
Figure 1.
Figure 1.
Membrane potential orientation tuning. A–C, Membrane potential responses for a well tuned (A), moderately tuned (B), and poorly tuned (C) neuron. The resting membrane potentials for each of these cells was −69.9 mV (A), −59.3 mV (B), and −65.6 mV (C). For each neuron, the left panel shows membrane potential responses to gratings of different orientations; the right top and bottom panels show spike rate and membrane potential orientation tuning curves, respectively; the OSI of each tuning curve is at the curve's top left.
Figure 2.
Figure 2.
Membrane potential orientation tuning distribution. A, Histogram of spike rate OSI in mouse (gray) and cat (black) V1. B, Histogram of membrane potential OSI in mouse and cat V1. C, Three example neurons with different membrane potential to spike rate transformations. The black symbols indicate average spike rate when membrane potential is binned into 1 mV steps (error bars are SDs). The red trace indicates the power law that best fits the data. D, Spike rate OSI versus membrane potential OSI in mouse and cat V1. Neurons were grouped by the exponent p that best fit the membrane potential-to-spike rate relationship: p < 2.5 (blue), p > 3.5 (black), and p intermediate between those values (red). Blue, red, and black solid lines indicate the predicted relationship given respective exponent values of 2, 3, and 5. E, Predicted and actual spike rate OSIs. The predicted spike rate OSI is derived from the membrane potential responses being passed through the threshold nonlinearity.
Figure 3.
Figure 3.
Excitatory, inhibitory, and membrane potential orientation selectivity. A, An example neuron for which conductances were estimated using voltage clamp. The top row indicates the membrane potential orientation selectivity recorded in current clamp (black traces, calibration: 2 mV). Predictions of membrane potential responses based on estimated conductances are also shown (cyan traces). The second row shows the currents measured when the neuron was voltage clamped at −16 mV (light blue) and −81 mV (light red, calibration: 20 pA). Excitatory and inhibitory conductances (blue and red traces, respectively, calibration: 0.4 nS) are shown for each orientation. B, Orientation selectivity for membrane potential (top, peak = 1.3 mV), excitatory conductance (middle, peak = 0.18 nS), and inhibitory conductance (bottom, peak = 0.32 nS). Error bars indicate the SEM. C, An example cell for which conductances were estimated using current clamp. The top panels show the membrane potential responses as the neuron was injected with 210, −30, or −173 pA (from black traces to gray traces). Excitatory and inhibitory conductances derived from those measurements are shown in the bottom traces (Ge, blue traces; Gi, red traces; calibration: 5 nS). Shaded regions indicate the 95% confidence intervals derived from bootstrap analysis. D, Orientation selectivity for membrane potential (extracted from the data taken when the neuron was hyperpolarized, peak = 12 mV), excitatory conductances (middle, peak = 3 nS), and inhibitory conductances as in B (peak = 2.2 nS). The inset values in these panels indicate the OSI for each tuning curve. The relationship between injected current and observed membrane potential is plotted for the three epochs indicated by arrows in C.
Figure 4.
Figure 4.
Excitatory, inhibitory, and membrane potential orientation tuning distribution. A, Histogram of Ge OSI. B, Histogram of Gi OSI. C, Histogram of membrane potential OSI. D, Gi OSI (red diamonds) and membrane potential OSI (black circles) versus Ge OSI. Open symbols indicate measurements from current-clamp recordings, filled symbols indicate measurements from voltage-clamp recordings. E, Conductance measurements for excitation (blue traces) and inhibition (red traces) for the preferred orientation (left column) and the orthogonal orientation (right column). The first row shows an example cat neuron, the second row shows an example mouse neuron. The stimulus began at beginning of the trace and was on for the duration of the trace (1.5 s are shown). Calibration bars indicate the size of the conductances (cat, 2 nS, mouse, 5 nS). F, OSI distribution for excitatory conductance (top panel) and inhibitory conductance (bottom panel).
Figure 5.
Figure 5.
The time course of orientation selectivity. A, B, Orientation tuning is plotted for two example neurons as a function of time. Membrane potential (black), Ge (blue), and Gi (red) tunings are plotted in 25 ms intervals. Insets plot the OSI for each response type as a function of time. A, Calibration: 3.5 mV, 0.45 nS (Ge) and 0.9 nS (GI). B, Calibration: 10.5 mV, 2.25 nS (Ge) and 4.5 nS (Gi). C, Geometric mean of OSI, as fraction of initial OSI for Vm (black, n = 15 neurons), Ge (blue, n = 17), and Gi (red, n = 17). D, Difference between Ge OSI and Vm OSI (n = 15). E, Difference between Gi OSI and Vm OSI (n = 15).
Figure 6.
Figure 6.
Preferred orientation Ge and Gi adaptation. A, B, The time course of Ge and Gi for two example neurons showing adaptation. Gray indicates the early and late response time windows of equal duration. C, Late Ge versus early Ge. D, Late Gi versus early Gi. E, Late Ge/Gi ratio versus early Ge/Gi ratio.
Figure 7.
Figure 7.
The timing of excitatory and inhibitory conductances. A, The top traces show the membrane potential responses of a cat simple cell to its preferred orientation, recorded while injecting different amounts of current (180, 0, and −180 pA) to extract excitatory and inhibitory conductances. The drifting grating started at the beginning of the trace with a temporal frequency of 2 Hz. The period of stimulation shown is 1.5 s. Excitatory (blue) and inhibitory (red) conductances based on those membrane potential responses show asynchronous excitation and inhibition. The phase angles for excitation (blue) and inhibition (red) are shown as vectors on a normalized polar plot (bottom panel). B, As in A, but for an example mouse neuron (currents: −173, −30, 210 pA). The calibration bar indicates the size of the conductances (cat, 2 nS, mouse, 5 nS). The neuron in B is the same as in Figure 3C. C, A histogram of the difference in phase angle for excitation and inhibition for mouse neurons (gray) and cat neurons (black, n = 14).
Figure 8.
Figure 8.
Patterns of excitatory and inhibitory convergence underlying orientation tuning. A, Well tuned excitatory neurons and broadly tuned inhibitory neurons with similar preferred orientations converge to produce broadly tuned excitation and inhibition with similar preferred orientations. B, Well tuned excitatory and inhibitory neurons with similar preferred orientations converge to produce broadly tuned excitation and inhibition with similar preferred orientations. C, Well tuned excitatory and inhibitory neurons with orthogonal preferred orientations converge to produce broadly tuned excitation and inhibition with orthogonal preferred orientations. Our data are consistent with A or B.

References

    1. Adesnik H, Scanziani M. Lateral competition for cortical space by layer-specific horizontal circuits. Nature. 2010;464:1155–1160. - PMC - PubMed
    1. Alitto HJ, Dan Y. Function of inhibition in visual cortical processing. Curr Opin Neurobiol. 2010;20:340–346. - PMC - PubMed
    1. Anderson JS, Carandini M, Ferster D. Orientation tuning of input conductance, excitation, and inhibition in cat primary visual cortex. J Neurophysiol. 2000;84:909–926. - PubMed
    1. Azouz R, Gray CM. Cellular mechanisms contributing to response variability of cortical neurons in vivo. J Neurosci. 1999;19:2209–2223. - PMC - PubMed
    1. Azouz R, Gray CM. Dynamic spike threshold reveals a mechanism for synaptic coincidence detection in cortical neurons in vivo. Proc Natl Acad Sci U S A. 2000;97:8110–8115. - PMC - PubMed

Publication types

LinkOut - more resources