

Foods, fortificants, and supplements: Where do Americans get their nutrients?
- PMID: 21865568
- PMCID: PMC3174857
- DOI: 10.3945/jn.111.142257
Foods, fortificants, and supplements: Where do Americans get their nutrients?
Abstract
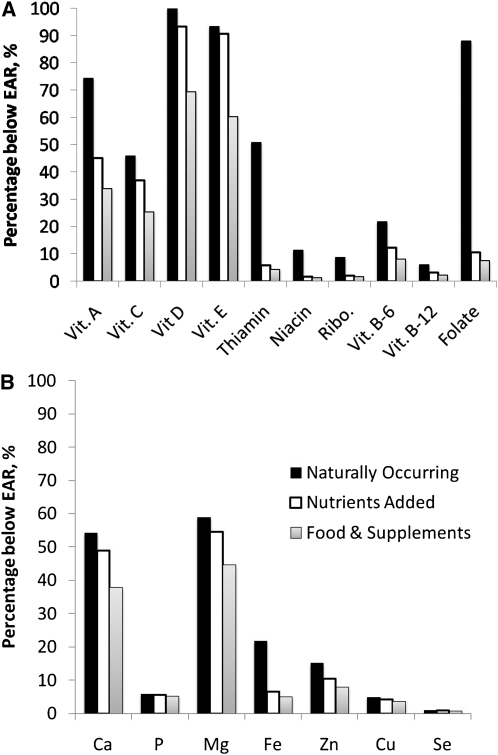
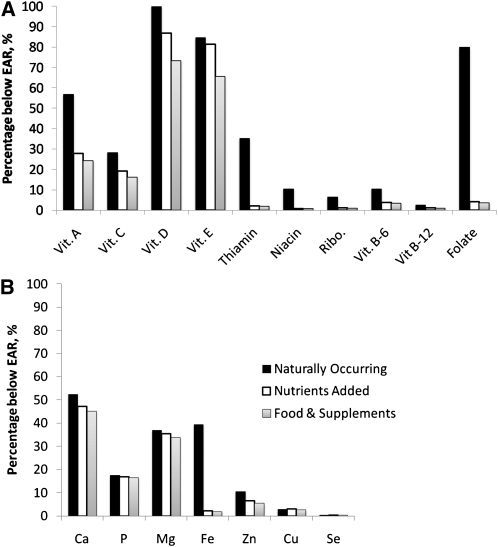
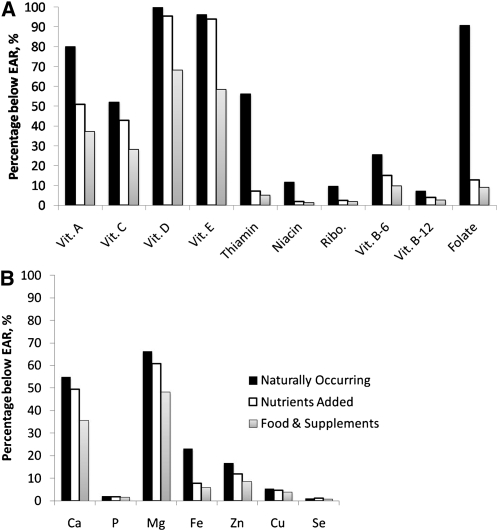
Limited data are available on the source of usual nutrient intakes in the United States. This analysis aimed to assess contributions of micronutrients to usual intakes derived from all sources (naturally occurring, fortified and enriched, and dietary supplements) and to compare usual intakes to the Dietary Reference Intake for U.S. residents aged ≥2 y according to NHANES 2003-2006 (n = 16,110). We used the National Cancer Institute method to assess usual intakes of 19 micronutrients by source. Only a small percentage of the population had total usual intakes (from dietary intakes and supplements) below the estimated average requirement (EAR) for the following: vitamin B-6 (8%), folate (8%), zinc (8%), thiamin, riboflavin, niacin, vitamin B-12, phosphorus, iron, copper, and selenium (<6% for all). However, more of the population had total usual intakes below the EAR for vitamins A, C, D, and E (34, 25, 70, and 60%, respectively), calcium (38%), and magnesium (45%). Only 3 and 35% had total usual intakes of potassium and vitamin K, respectively, greater than the adequate intake. Enrichment and/or fortification largely contributed to intakes of vitamins A, C, and D, thiamin, iron, and folate. Dietary supplements further reduced the percentage of the population consuming less than the EAR for all nutrients. The percentage of the population with total intakes greater than the tolerable upper intake level (UL) was very low for most nutrients, whereas 10.3 and 8.4% of the population had intakes greater than the UL for niacin and zinc, respectively. Without enrichment and/or fortification and supplementation, many Americans did not achieve the recommended micronutrient intake levels set forth in the Dietary Reference Intake.
Conflict of interest statement
Author disclosures: V. L. Fulgoni III, D. R. Keast, R. L. Bailey, and J. Dwyer, no conflicts of interest.
Figures
References
-
- USDA Center for Nutrition Policy and Promotion The Report of the Dietary Guidelines Advisory Committee on the Dietary Guidelines for Americans, 2010 [internet]. Alexandria (VA): USDA Center for Nutrition Policy and Promotion; 2010. [cited 28 Oct 2010]. Available from: http://www.cnpp.usda.gov/DGAs2010-DGACReport.htm
-
- Bouchard C. The magnitude of the energy imbalance in obesity is generally underestimated. Int J Obes (Lond). 2008;32:879–80 - PubMed
-
- Butte NF, Ellis KJ. Comment on obesity and the environment: where do we go from here? Science. 2003;301:598. - PubMed
-
- Butte NF, Christiansen E, Sorensen TIA. Energy imbalance underlying the development of childhood obesity. Obesity (Silver Spring). 2007;15:3056–66 - PubMed
Publication types
MeSH terms
Substances
LinkOut - more resources
Full Text Sources
Other Literature Sources
Medical
Molecular Biology Databases
