. 2011 Oct;22(20):3902-15.
doi: 10.1091/mbc.E11-01-0047. Epub 2011 Aug 24.

Prevention of estradiol 17beta-D-glucuronide-induced canalicular transporter internalization by hormonal modulation of cAMP in rat hepatocytes

Affiliations

Prevention of estradiol 17beta-D-glucuronide-induced canalicular transporter internalization by hormonal modulation of cAMP in rat hepatocytes

Andrés E Zucchetti et al. Mol Biol Cell. 2011 Oct.

Abstract

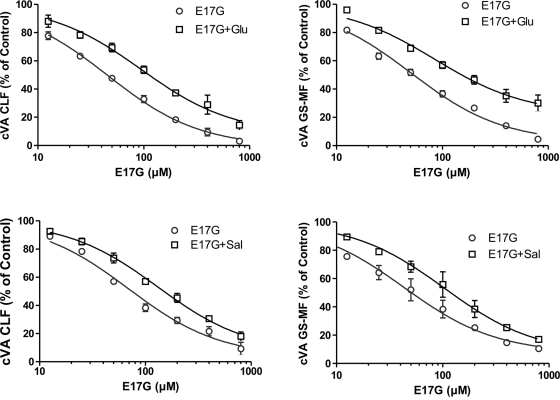
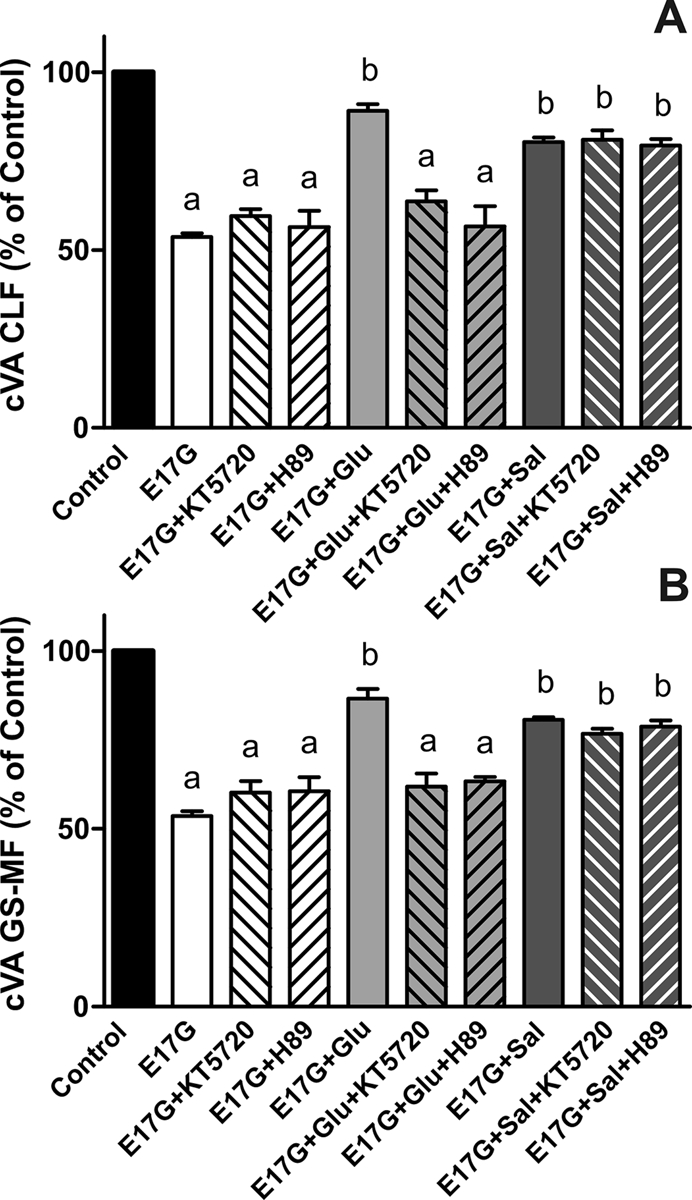
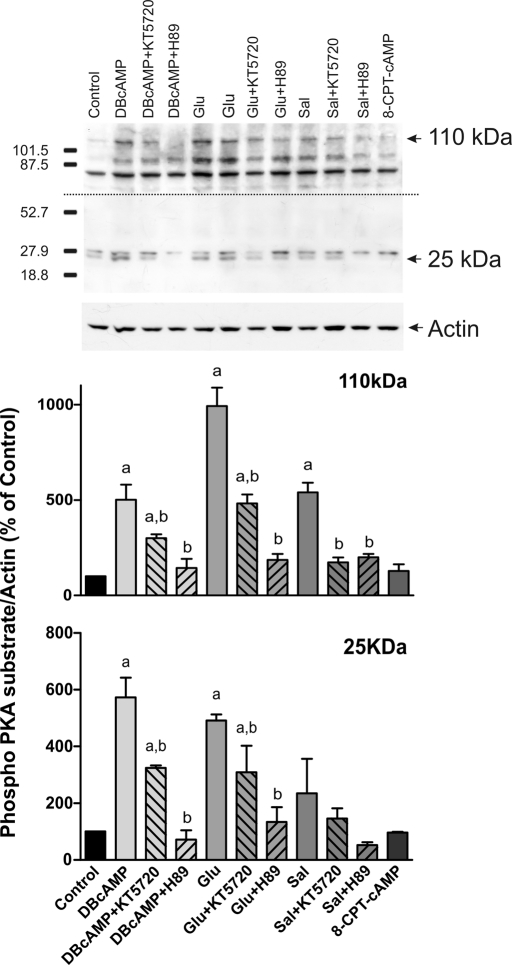
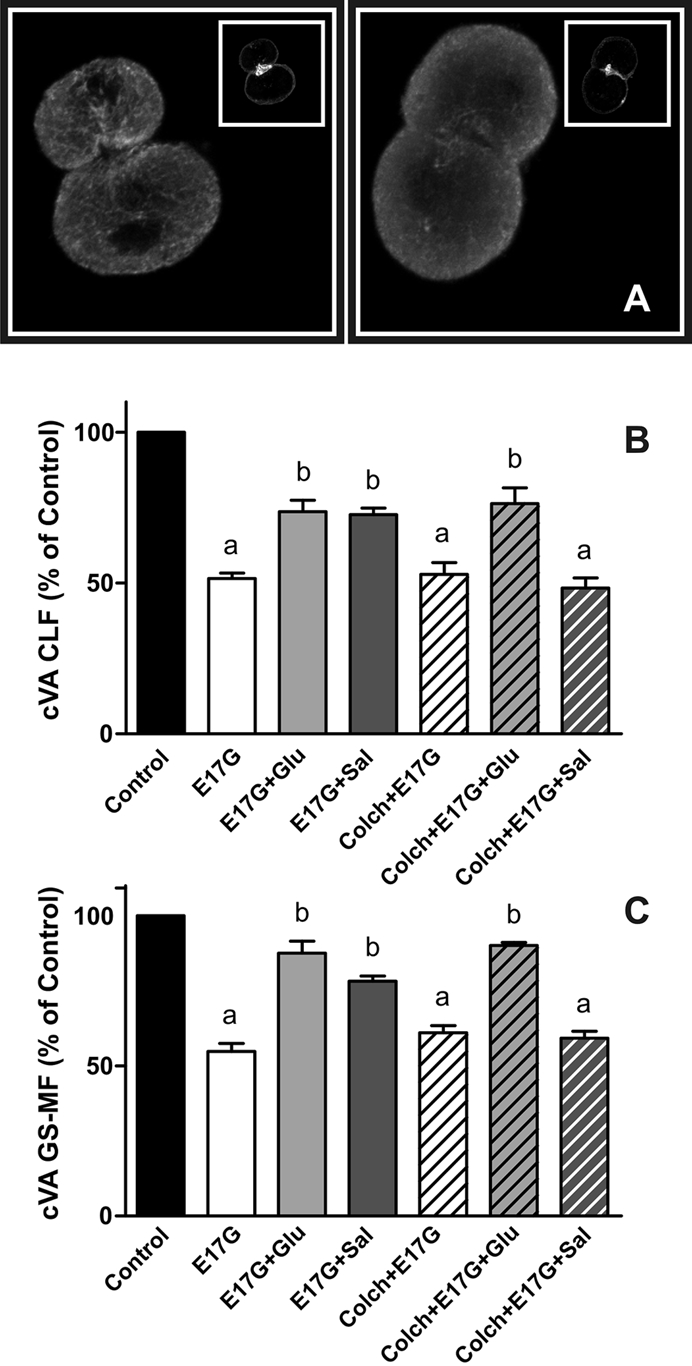
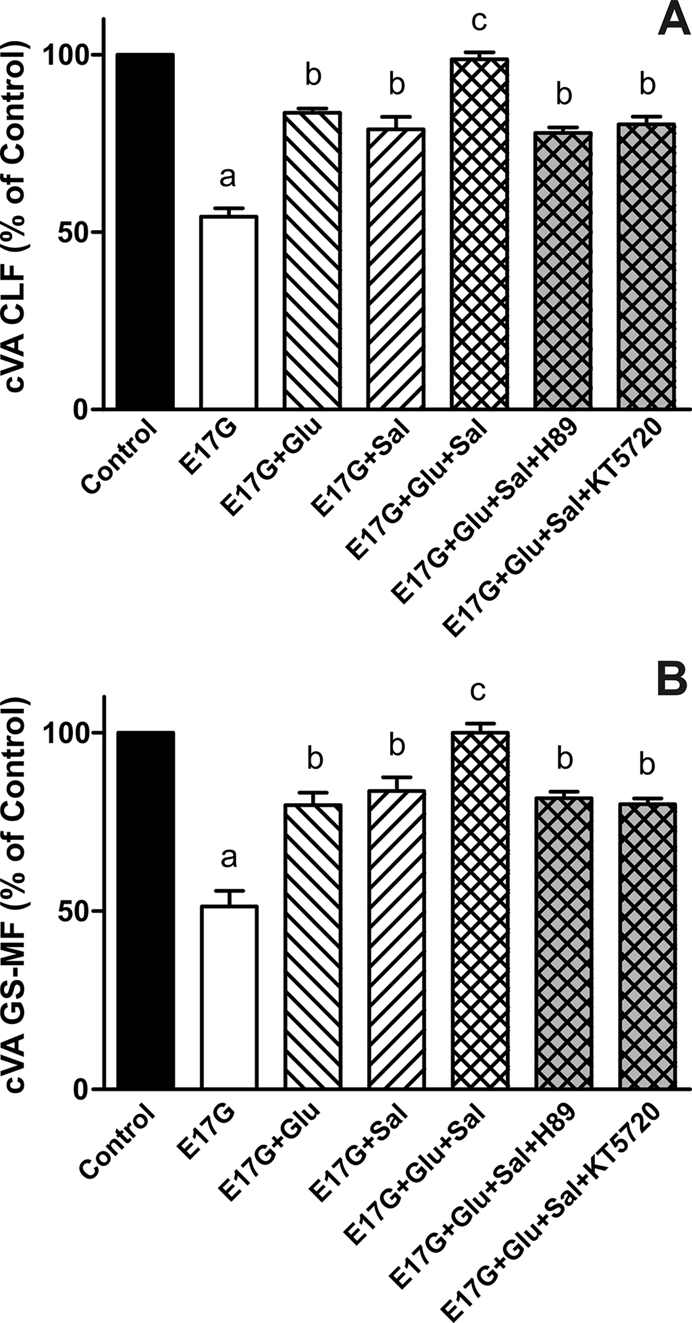
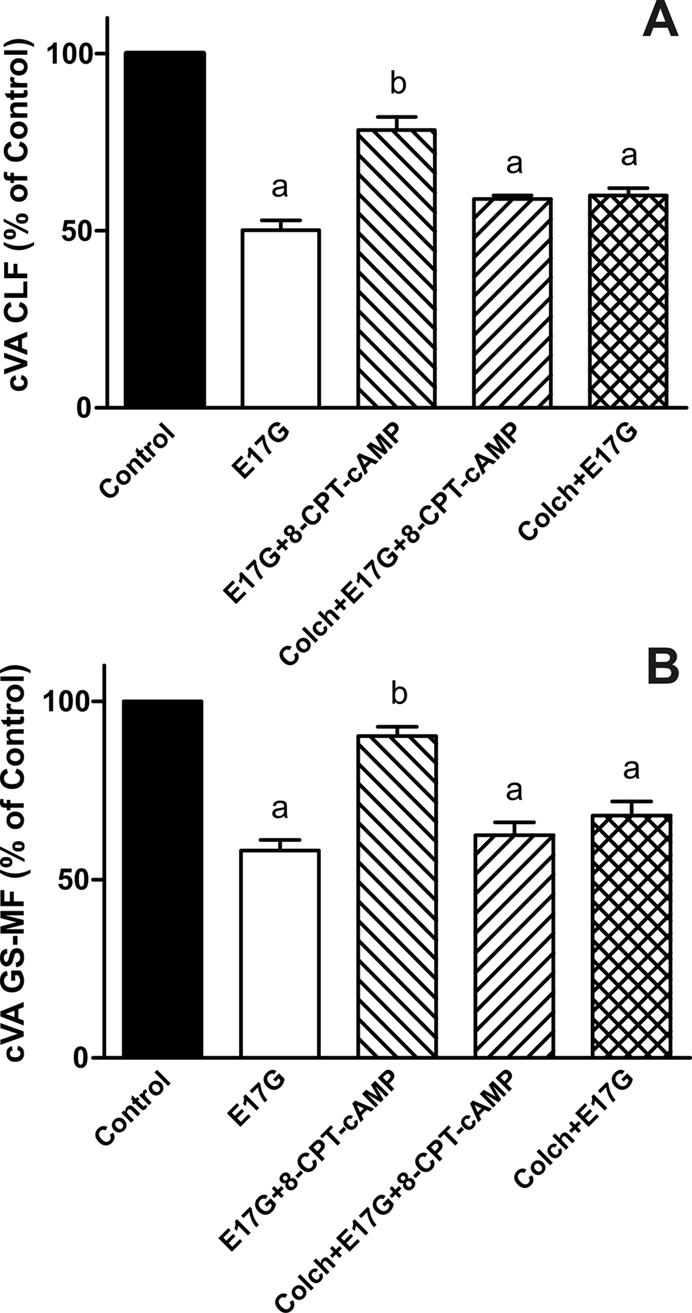
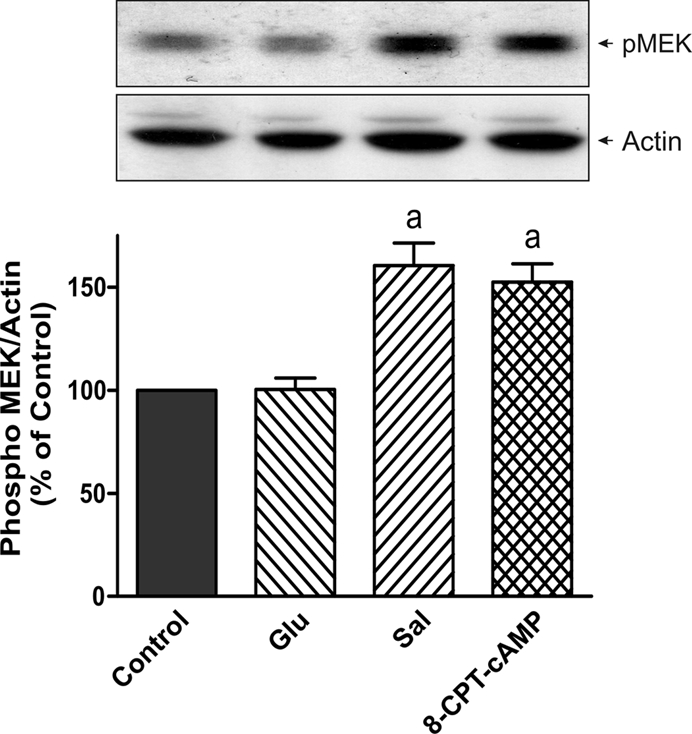
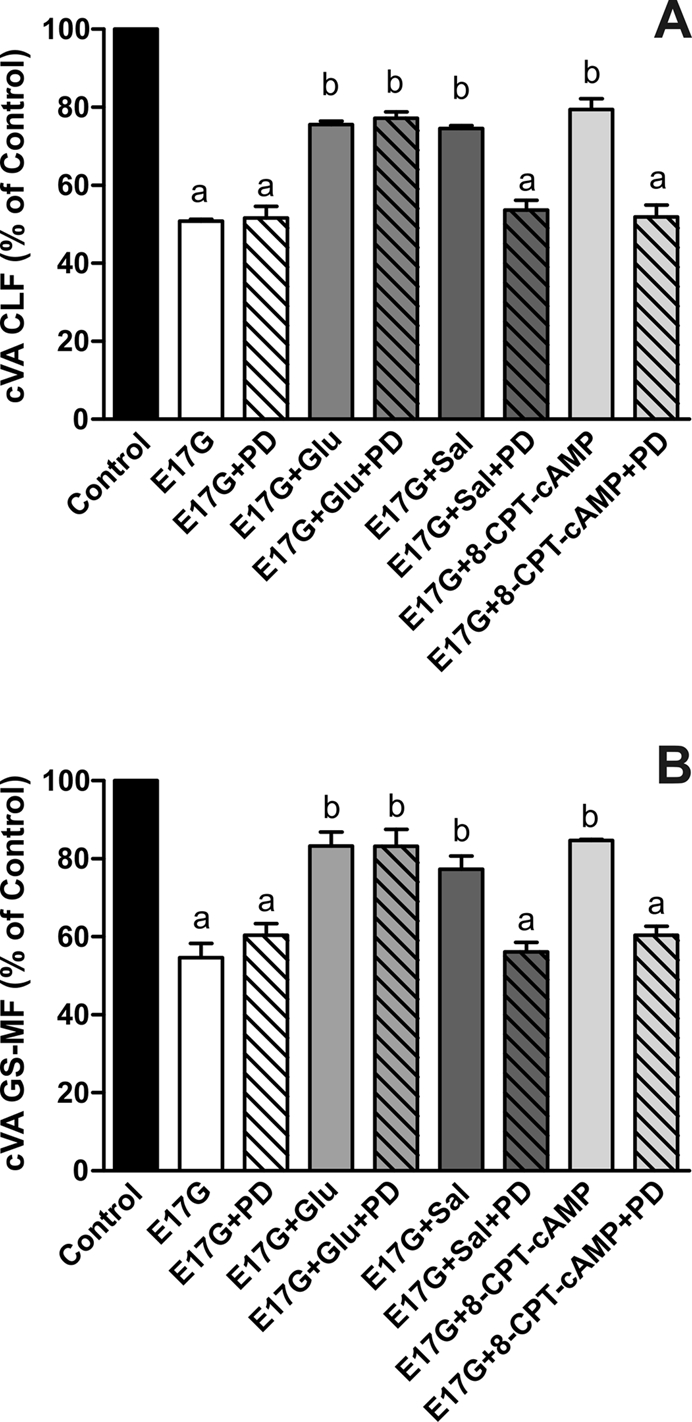
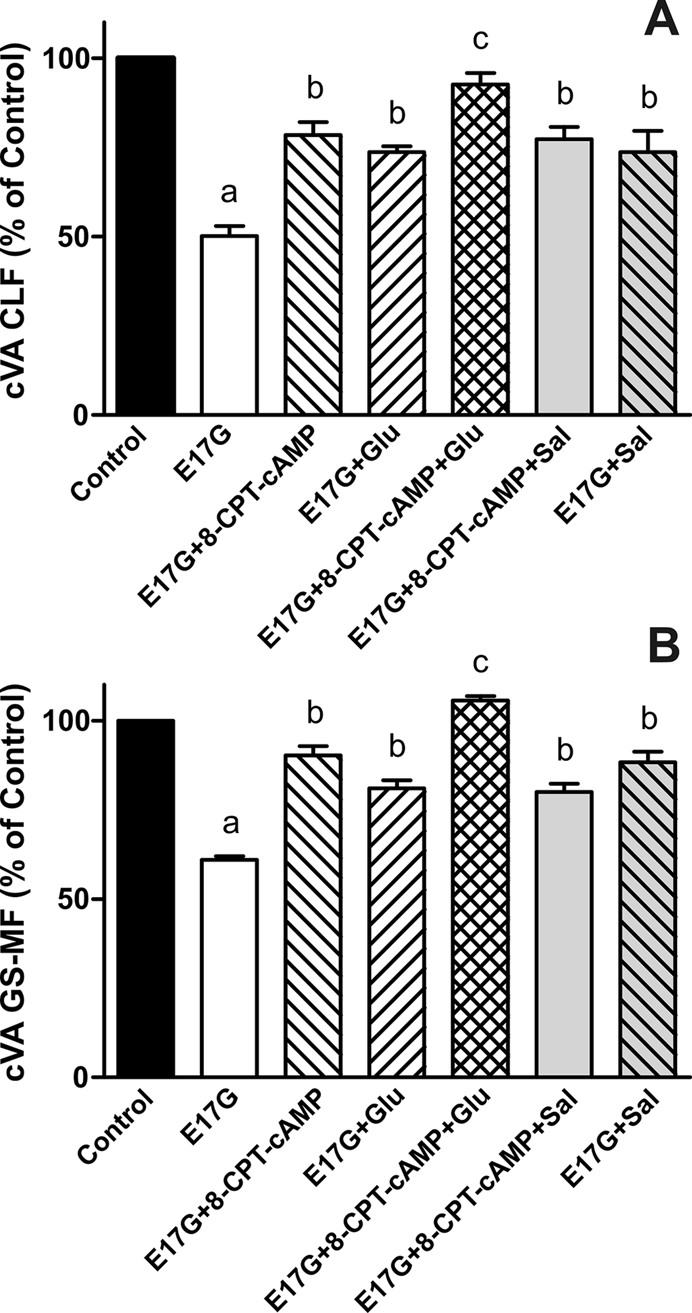
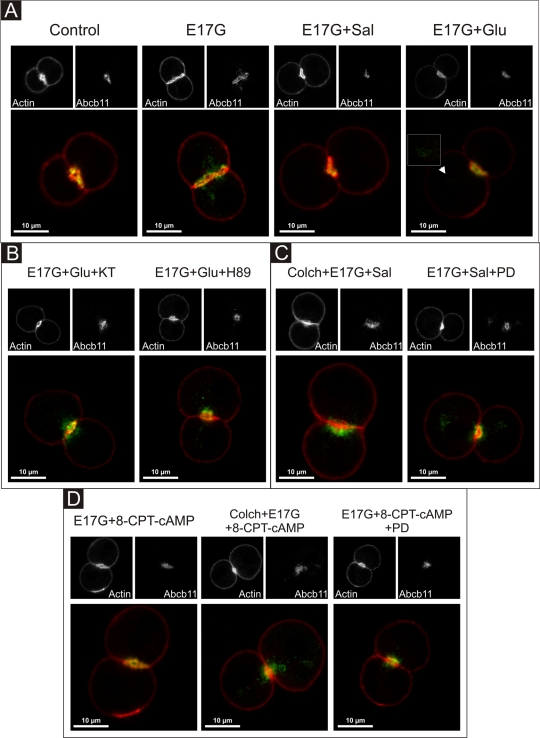
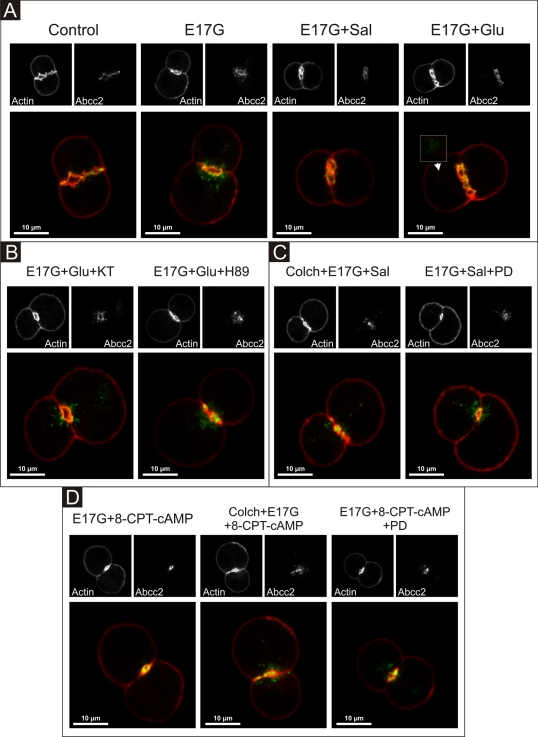
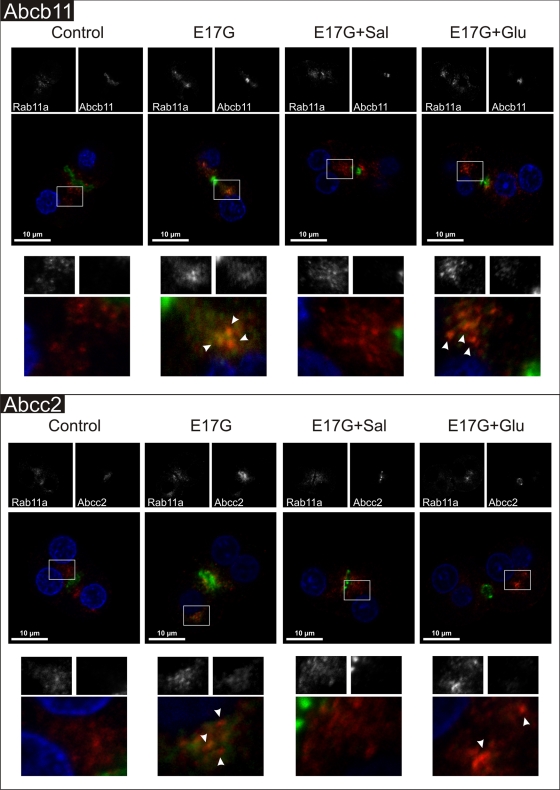
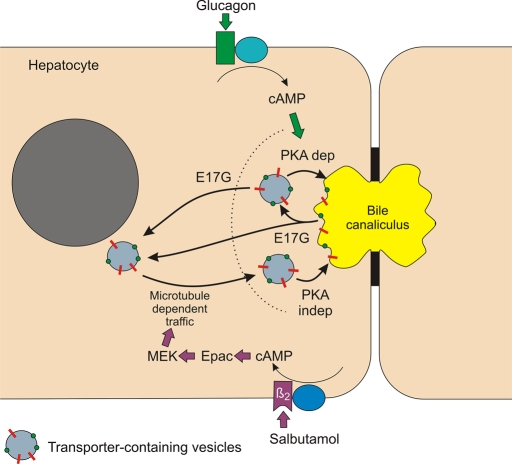
In estradiol 17β-d-glucuronide (E17G)-induced cholestasis, the canalicular hepatocellular transporters bile salt export pump (Abcb11) and multidrug-resistance associated protein 2 (Abcc2) undergo endocytic internalization. cAMP stimulates the trafficking of transporter-containing vesicles to the apical membrane and is able to prevent internalization of these transporters in estrogen-induced cholestasis. Hepatocyte levels of cAMP are regulated by hormones such as glucagon and adrenaline (via the β2 receptor). We analyzed the effects of glucagon and salbutamol (a β2 adrenergic agonist) on function and localization of Abcb11 and Abcc2 in isolated rat hepatocyte couplets exposed to E17G and compared the mechanistic bases of their effects. Glucagon and salbutamol partially prevented the impairment in Abcb11 and Abcc2 transport capacity. E17G also induced endocytic internalization of Abcb11 and Abcc2, which partially colocalized with the endosomal marker Rab11a. This effect was completely prevented by salbutamol, whereas some transporter-containing vesicles remained internalized and mainly colocalizing with Rab11a in the perinuclear region after incubation with glucagon. Glucagon prevention was dependent on cAMP-dependent protein kinase (PKA) and independent of exchange proteins activated directly by cAMP (Epac) and microtubules. In contrast, salbutamol prevention was PKA independent and Epac/MEK and microtubule dependent. Anticholestatic effects of glucagon and salbutamol were additive in nature. Our results show that increases in cAMP could activate different anticholestatic signaling pathways, depending on the hormonal mediator involved.


Figures

FIGURE 1:
FIGURE 1:
Prevention by Glu (top) and Sal (bottom) of E17G-induced impairment of cVA of CLF (left) and GS-MF (right). IRHCs were preincubated with Glu (0.1 μM) or Sal (1 μM) for 15 min and then exposed to E17G (12.5–800 μM) for an additional 20 min. cVAs of CLF and GS-MF were calculated as the percentage of couplets displaying visible fluorescence in their canalicular vacuoles from a total of at least 200 couplets per preparation, referred to control cVA values. cVA control values were 75 ± 2% for CLF and 76 ± 2% for GS-MF. Data are expressed as mean ± SEM (n = 3).
FIGURE 2:
FIGURE 2:
Effect of the PKA inhibitors H-89 and KT5720 on the prevention by Glu and Sal of E17G-induced impairment of cVA of CLF (A) and GS-MF (B). Couplets pretreated for 15 min with H-89 (200 nM), KT5720 (50 nM), or vehicle (DMSO) in controls were subsequently exposed to Glu or Sal for a further 15-min period and then exposed to E17G (50 μM) for an additional 20-min period. cVAs of CLF and GS-MF were calculated as the percentage of couplets displaying visible fluorescence in their canalicular vacuoles from a total of at least 200 couplets per preparation, referred to control cVA values. Control cVA values were 76 ± 1% for CLF and 76 ± 2% for GS-MF. Data are expressed as mean ± SEM (n = 3). aSignificantly different from control (p < 0.05). bSignificantly different from E17G and control (p < 0.05).
FIGURE 3:
FIGURE 3:
Estimation of PKA activation by Glu and Sal. Isolated rat hepatocytes were incubated with DBcAMP (10 μM, positive control), Glu (0.1 μM), Sal (1 μM), and 8-CPT-2´-O-Me-cAMP (8-CPT-cAMP, 50 μM, negative control) in the presence or absence of PKA inhibitors (50 nM KT5720 or 200 nM H-89). PKA activity was determined by Western blot, using an antibody against phosphorylated PKA substrates. Two bands of 25 and 110 kDa were analyzed based on their response to DBcAMP and PKA inhibitors. Two exposure times were necessary to reveal these bands, a short exposure for the 25-kDa band and a long exposure for the 110-kDa band. Differences in sample loading were corrected by the densitometric signal of the corresponding actin band. The ratio of each phosphorylated substrate/actin band density was compared with that of control bands (100%). Data are expressed as mean ± SEM (n = 3). aSignificantly different from control (p < 0.05). bSignificantly different from the agonist alone (p < 0.05).
FIGURE 4:
FIGURE 4:
(A) Representative confocal images of control-treated (left) and colchicine-treated (right) IRHCs stained for β-tubulin and actin (inset). (B, C) Effect of colchicine on Glu and Sal prevention of E17G-induced impairment of cVAs of CLF (B) and GS-MF (C). Couplets pretreated for 30 min with colchicine (Colch, 1 μM) or vehicle (DMSO) were subsequently exposed to Glu (0.1 μM) or Sal (1 μM) for 15 min and then exposed to E17G (50 μM) for an additional 20 min. cVAs of CLF and GS-MF were calculated as the percentage of couplets displaying visible fluorescence in their canalicular vacuoles from a total of at least 200 couplets per preparation, referred to control cVA values. Control cVA values were 75 ± 3% for CLF and 76 ± 1% for GS-MF. Data are expressed as mean ± SEM (n = 3). aSignificantly different from control (p < 0.05). bSignificantly different from E17G and control (p < 0.05).
FIGURE 5:
FIGURE 5:
Effect of coincubation with Glu and Sal on E17G-induced impairment of canalicular vacuolar accumulations (cVAs) of CLF (A) and GS-MF (B). IRHCs were incubated with Glu (0.1 μM) and Sal (1 μM), either alone or together, for 15 min and then exposed to E17G (50 μM) for an additional 20 min. Finally cVAs of CLF and GS-MF were calculated as the percentage of couplets displaying visible fluorescence in their canalicular vacuoles from a total of at least 200 couplets per preparation, referred to control cVA values. Control cVA values were 76 ± 3% for CLF and 75 ± 1% for GS-MF. Data are expressed as mean ± SEM (n = 3). aSignificantly different from control (p < 0.05). bSignificantly different from E17G and control (p < 0.05).cSignificantly different from E17G, E17G + Glu, E17G + Sal, E17G + Glu + Sal + H-89, and E17G + Glu + Sal + KT5720 (p < 0.05).
FIGURE 6:
FIGURE 6:
Effect of colchicine on the prevention of E17G-induced impairment in the canalicular vacuolar accumulation (cVA) of CLF (A) and GS-MF (B) afforded by activation of the Epac pathway with 8-CPT-2´-O-Me-cAMP. IRHCs were preincubated with colchicine for 30 min and then with 8-CPT-2´-O-Me-cAMP (8-CPT-cAMP, 50 μM) for a further 15 min and subsequently exposed to E17G (50 μM) for an additional 20 min. Finally, cVAs of CLF and GS-MF were calculated as the percentage of couplets displaying visible fluorescence in their canalicular vacuoles from a total of at least 200 couplets per preparation, referred to control cVA values. Control cVA values were 74 ± 1% for CLF and 75 ± 2% for GS-MF. Data are expressed as mean ± SEM (n = 3). aSignificantly different from control (p < 0.05). bSignificantly different from E17G and control (p < 0.05).
FIGURE 7:
FIGURE 7:
Estimation of MEK activation by salbutamol and 8-CPT-2´-O-Me-cAMP. Isolated rat hepatocytes were incubated with Glu (0.1 μM), Sal (1 μM), and 8-CPT-2´-O-Me-cAMP (8-CPT-cAMP, 50 μM, positive control). MEK activity was determined by immunoblots, using an antibody against phosphorylated MEK1/2. A band at 45 kDa was detected. Differences in sample loading were corrected by the densitometric signal of the corresponding actin band. The ratio of each pMEK/actin band density was compared with the ratio of control bands (100%). Data are expressed as mean ± SEM (n = 3). aSignificantly different from control (p < 0.05).
FIGURE 8:
FIGURE 8:
Effect of MEK1/2 inhibitor PD98059 on Glu, Sal, and 8-CPT-2´-O-Me-cAMP prevention of E17G-induced impairment of canalicular vacuolar accumulations (cVAs) of CLF (A) and GS-MF (B). Couplets pretreated for 15 min with PD98059 (PD, 1 μM) or vehicle (DMSO) were subsequently exposed to Glu (0.1 μM), Sal (1 μM), or 8-CPT-2´-O-Me-cAMP (8-CPT-cAMP, 50 μM) for 15 min and then exposed to E17G (50 μM) for an additional 20 min. cVAs of CLF and GS-MF were calculated as the percentage of couplets displaying visible fluorescence in their canalicular vacuoles from a total of at least 200 couplets per preparation, referred to control cVA values. Control cVA values were 75 ± 1% for CLF and 76 ± 2% for GS-MF. Data are expressed as mean ± SEM (n = 3). aSignificantly different from control (p < 0.05). bSignificantly different from E17G and control (p < 0.05).
FIGURE 9:
FIGURE 9:
Effect of coincubation with Glu + 8-CPT-2´-O-Me-cAMP and Sal + 8-CPT-2´-O-Me-cAMP on E17G-induced impairment of cVA of CLF (A) and GS-MF (B). IRHCs were coincubated with Glu (0.1 μM) and 8-CPT-2´-O-Me-cAMP (8-CPT-cAMP, 50 μM), or Sal (1 μM) and 8-CPT-2´-O-Me-cAMP, for 15 min and then exposed to E17G (50 μM) for an additional 20 min. Finally cVAs of CLF and GS-MF were calculated as the percentage of couplets displaying visible fluorescence in their canalicular vacuoles from a total of at least 200 couplets per preparation, referred to control cVA values. Control cVA values were 77 ± 3% for CLF and 74 ± 1% for GS-MF. Data are expressed as mean ± SEM (n = 3). aSignificantly different from control (p < 0.05). bSignificantly different from E17G and control (p < 0.05).cSignificantly different from E17G, E17G + Glu, and E17G + 8-CPT-cAMP (p < 0.05).
FIGURE 10:
FIGURE 10:
Representative confocal images showing cellular distribution of Abcb11, actin, and merged images (with actin in red and Abcb11 in green) in IRHCs under different treatments. (A) Prevention by Glu (0.1 μM) and Sal (1 μM) of E17G (200 μM)-induced retrieval of Abcb11. Note that under control conditions Abcb11-associated fluorescence is mainly localized at the canalicular membrane in the area delimited by the pericanalicular actin ring. E17G induced a clear internalization of Abcb11-containing vesicles beyond the limits of the pericanalicular actin ring, a phenomenon significantly prevented by Glu and Sal. The arrowhead in the E17G + Glu group shows some transporter-containing vesicles that remain internalized in a deep intracellular compartment. (B) Preincubation with the PKA inhibitor H-89 (200 nM) or KT5720 (KT, 50 nM) significantly inhibited the preventive effect of Glu on E17G-induced internalization of Abcb11. (C) Pretreatment of IRHC with the microtubule-disrupting agent colchicine (Colch, 1 μM), or the MEK1/2 inhibitor PD98059 (PD, 1 μM) abolished the preventive effect of Sal on E17G-induced internalization of Abcb11. (D) Pretreatment of IRHC with 8-CPT-2´-O-Me-cAMP (8-CPT-cAMP, 50 μM), an Epac agonist, also prevented delocalization of Abcb11 induced by E17G, a phenomenon also abolished by preincubation with Colch and PD. None of the treatments affected the normal distribution of actin, which showed a predominant pericanalicular distribution.
FIGURE 11:
FIGURE 11:
Representative confocal images showing cellular distribution of Abcc2, actin, and merged images (with actin in red and Abcc2 in green) in IRHCs under different treatments. (A) Prevention by Glu (0.1 μM) and Sal (1 μM) of E17G (200 μM)-induced retrieval of Abcc2. Note that under control conditions Abcc2-associated fluorescence is mainly localized at the canalicular membrane in the area delimited by the pericanalicular actin ring. E17G induced a clear internalization of Abcc2-containing vesicles beyond the limits of the pericanalicular actin ring, a phenomenon significantly prevented by Glu and Sal. The arrowhead in the E17G + Glu group shows some transporter-containing vesicles that remain internalized in a deep intracellular compartment. (B) Preincubation with the PKA inhibitor H-89 (200 nM) or KT5720 (KT, 50 nM) significantly inhibited the preventive effect of Glu on E17G-induced internalization of Abcc2. (C) Pretreatment of IRHCs with the microtubule-disrupting agent colchicine (Colch, 1 μM) or the MEK1/2 inhibitor PD98059 (PD, 1 μM) abolished the preventive effect of Sal on E17G-induced internalization of Abcc2. (D) Pretreatment of IRHCs with 8-CPT-2´-O-Me-cAMP (8-CPT-cAMP, 50 μM), an Epac agonist, also prevented delocalization of Abcc2 induced by E17G, a phenomenon also abolished by preincubation with Colch and PD. None of the treatments affected the normal distribution of actin, which showed a predominant pericanalicular distribution.
FIGURE 12:
FIGURE 12:
Representative confocal images showing cellular distribution of canalicular transporters, endosomal marker Rab11a, and merged images (with endosomal marker in red, canalicular transporter in green, and nuclei in blue) in IRHCs under the different treatments. (Top) Prevention by Glu (0.1 μM) and Sal (1 μM) of E17G (200 μM)-induced retrieval of Abcb11. (Bottom) Prevention by Glu (0.1 μM) and Sal (1 μM) of E17G (200 μM)-induced retrieval of Abcc2. Square demarcated zones are shown amplified below the corresponding microphotographs. E17G induced a clear internalization of transporter-containing vesicles beyond the canalicular region, reaching the perinuclear zone and partially colocalizing with Rab11a (arrowheads), a phenomenon significantly prevented by Glu and Sal. The E17G + Glu group shows some transporter-containing vesicles that remained mainly colocalizing with the endosomal marker Rab11a in a deep intracellular compartment (arrowheads).
FIGURE 13:
FIGURE 13:
Proposed model for cAMP-dependent transporter reinsertion after their endocytic internalization induced by E17G. The cholestatic estrogen glucuronide produces deinsertion of canalicular transporters to a subapical vesicle pool and to a deeper endocytic compartment. Glu mediates the reinsertion of subapical transporters via a PKA-dependent mechanism. On the other hand, Sal, via Epac–MEK activation, promotes the microtubule-dependent trafficking of transporter-containing vesicles toward the canalicular pole from a deep endocytic pool, the final fusion of subapical vesicles with the apical membrane being independent of PKA.

Similar articles

Cited by

References

    1. Bollen M, Keppens S, Stalmans W. Specific features of glycogen metabolism in the liver. Biochem J. 1998;336:19–31. - PMC - PubMed
    1. Borst P, Elferink RO. Mammalian ABC transporters in health and disease. Annu Rev Biochem. 2002;71:537–592. - PubMed
    1. Bos JL, de Rooij J, Reedquist KA. Rap1 signalling: adhering to new models. Nat Rev Mol Cell Biol. 2001;2:369–377. - PubMed
    1. Bouscarel B, Matsuzaki Y, Le M, Gettys TW, Fromm H. Changes in G protein expression account for impaired modulation of hepatic cAMP formation after BDL. Am J Physiol. 1998;274:G1151–G1159. - PubMed
    1. Branum GD, Bowers BA, Watters CR, Haebig J, Cucchiaro G, Farouk M, Meyers WC. Biliary response to glucagon in humans. Ann Surg. 1991;213:335–340. - PMC - PubMed

Publication types

MeSH terms