

Strain-specific differences in perinatal rodent oligodendrocyte lineage progression and its correlation with human
- PMID: 21865655
- PMCID: PMC3225247
- DOI: 10.1159/000327242
Strain-specific differences in perinatal rodent oligodendrocyte lineage progression and its correlation with human
Abstract
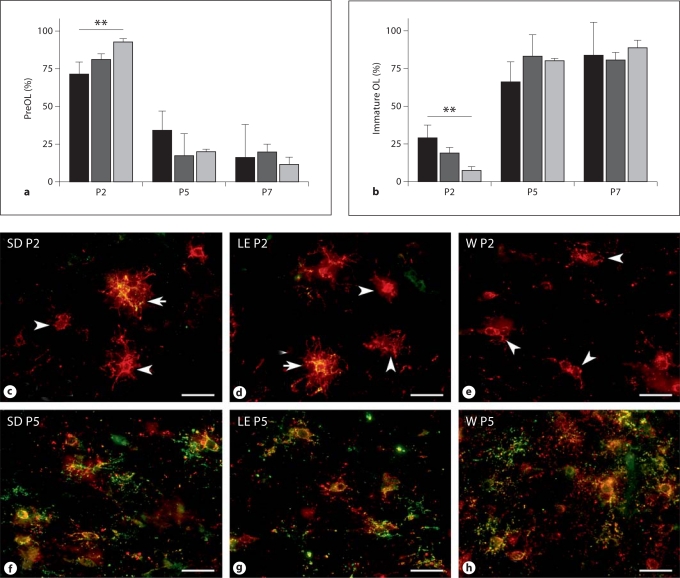
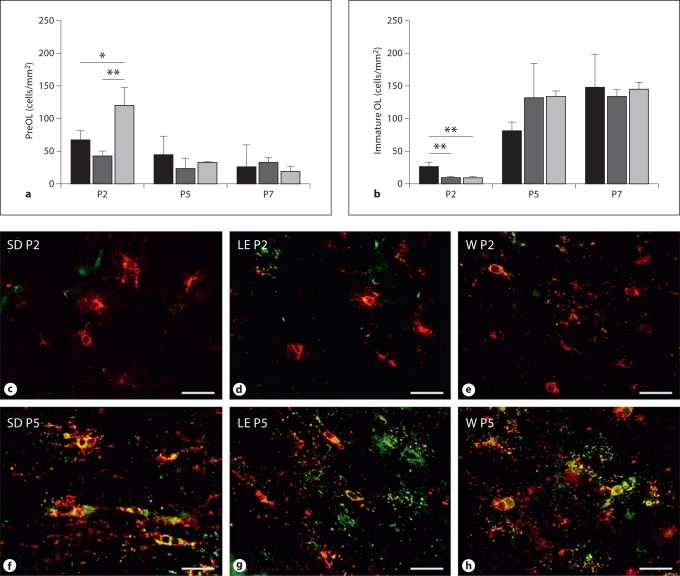
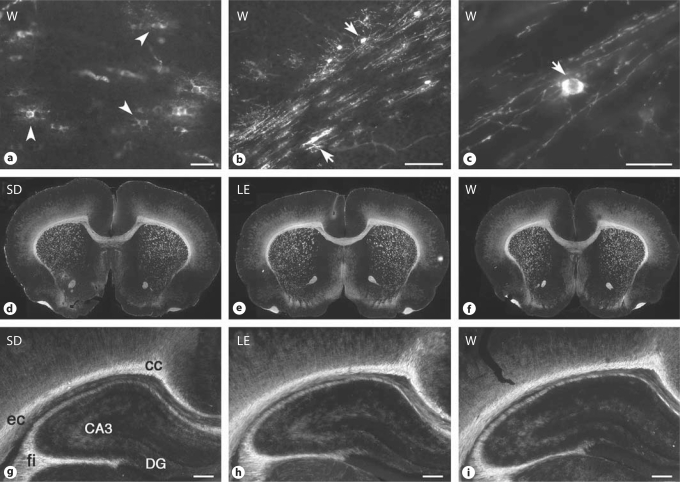
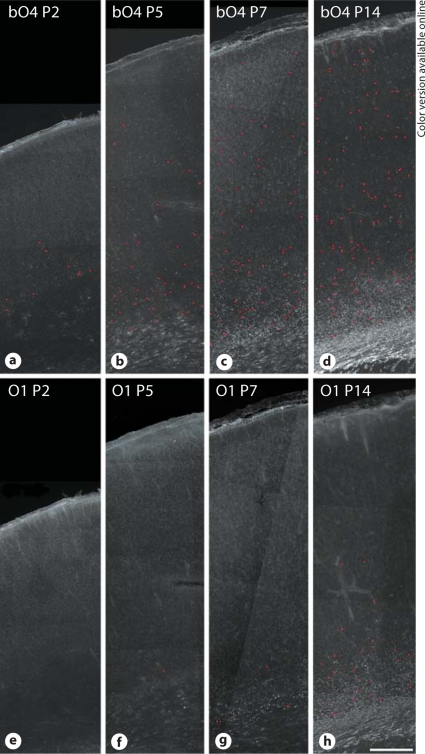
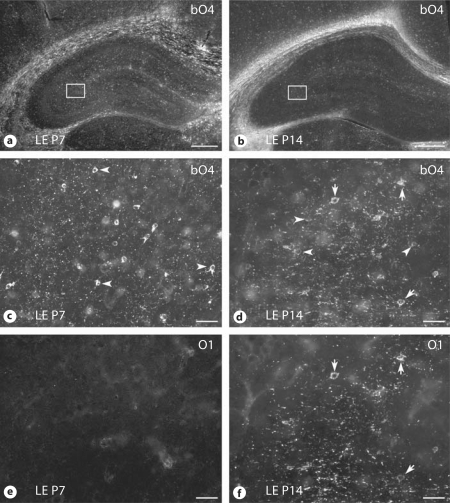
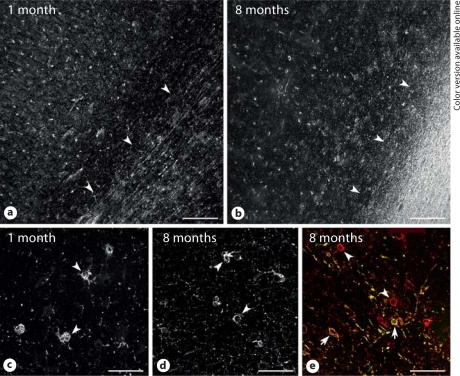
Progress in the development of rat models of human periventricular white matter injury (WMI) has been hampered by uncertainty about the developmental window in different rodent strains that coincides with cerebral white matter development in human premature infants. To define strain-specific differences in rat cerebral white matter maturation, we analyzed oligodendrocyte (OL) lineage maturation between postnatal days (P)2 and P14 in three widely studied strains of rat: Sprague-Dawley, Long-Evans and Wistar (W). We previously reported that late OL progenitors (preOL) are the major vulnerable cell type in human periventricular WMI. Strain-specific differences in preOL maturation were found at P2, such that the W rat had the highest percentage and density of preOL relative to the other strains. Overall, at P2, the state of OL maturation was similar to preterm human cerebral white matter. However, by P5, all three strains displayed a similar magnitude and extent of OL maturation that persisted with progressive myelination between P7 and P14. PreOL were the predominant OL lineage stage present in the cerebral cortex through P14, and thus OL lineage maturation occurred latter than in white matter. The hippocampus also displayed a later onset of preOL maturation in all three strains, such that OL lineage maturation and early myelination was not observed to occur until about P14. This timing of preOL maturation in rat cortical gray matter coincided with a similar timing in human cerebral cortex, where preOL also predominated until at least 8 months after full-term birth. These studies support that strain-specific differences in OL lineage immaturity were present in the early perinatal period at about P2, and they define a narrow window of preterm equivalence with human that diminishes by P5. Later developmental onset of preOL maturation in both cerebral cortex and hippocampus coincides with an extended window of potential vulnerability of the OL lineage to hypoxia-ischemia in these gray matter regions.
Copyright © 2011 S. Karger AG, Basel.
Figures
Similar articles
-
Quantitative analysis of perinatal rodent oligodendrocyte lineage progression and its correlation with human.Exp Neurol. 2003 Jun;181(2):231-40. doi: 10.1016/s0014-4886(03)00032-3. Exp Neurol. 2003. PMID: 12781996
-
Arrested oligodendrocyte lineage maturation in chronic perinatal white matter injury.Ann Neurol. 2008 Apr;63(4):520-30. doi: 10.1002/ana.21359. Ann Neurol. 2008. PMID: 18393269 Free PMC article.
-
Timing of appearance of late oligodendrocyte progenitors coincides with enhanced susceptibility of preterm rabbit cerebral white matter to hypoxia-ischemia.J Cereb Blood Flow Metab. 2010 May;30(5):1053-65. doi: 10.1038/jcbfm.2009.286. Epub 2010 Jan 13. J Cereb Blood Flow Metab. 2010. PMID: 20068573 Free PMC article.
-
White matter injury in the preterm infant: pathology and mechanisms.Acta Neuropathol. 2017 Sep;134(3):331-349. doi: 10.1007/s00401-017-1718-6. Epub 2017 May 22. Acta Neuropathol. 2017. PMID: 28534077 Free PMC article. Review.
-
Role of instrumented fetal sheep preparations in defining the pathogenesis of human periventricular white-matter injury.J Child Neurol. 2006 Jul;21(7):582-9. doi: 10.1177/08830738060210070101. J Child Neurol. 2006. PMID: 16970848 Review.
Cited by
-
Early postnatal irradiation-induced age-dependent changes in adult mouse brain: MRI based characterization.BMC Neurosci. 2021 Apr 21;22(1):28. doi: 10.1186/s12868-021-00635-2. BMC Neurosci. 2021. PMID: 33882822 Free PMC article.
-
Rapid nonapeptide synthesis during a critical period of development in the prairie vole: plasticity of the paraventricular nucleus of the hypothalamus.Brain Struct Funct. 2018 Jul;223(6):2547-2560. doi: 10.1007/s00429-018-1640-2. Epub 2018 Mar 9. Brain Struct Funct. 2018. PMID: 29523998 Free PMC article.
-
Role of recurrent hypoxia-ischemia in preterm white matter injury severity.PLoS One. 2014 Nov 12;9(11):e112800. doi: 10.1371/journal.pone.0112800. eCollection 2014. PLoS One. 2014. PMID: 25390897 Free PMC article.
-
The challenge of understanding cerebral white matter injury in the premature infant.Neuroscience. 2014 Sep 12;276:216-38. doi: 10.1016/j.neuroscience.2014.04.038. Epub 2014 May 15. Neuroscience. 2014. PMID: 24838063 Free PMC article. Review.
-
Glucocorticoids and preterm hypoxic-ischemic brain injury: the good and the bad.J Pregnancy. 2012;2012:751694. doi: 10.1155/2012/751694. Epub 2012 Aug 16. J Pregnancy. 2012. PMID: 22970371 Free PMC article. Review.
References
-
- Back SA. Perinatal white matter injury: the changing spectrum of pathology and emerging insights into pathogenetic mechanisms. Ment Retard Dev Disabil Res Rev. 2006;12:129–140. - PubMed
-
- Back SA, Luo NL, Mallinson RA, O'Malley JP, Wallen LD, Frei B, Morrow JD, Petito CK, Roberts JCT, Murdoch GH, Montine TJ. Selective vulnerability of preterm white matter to oxidative damage defined by F2-isoprostanes. Ann Neurol. 2005;58:108–120. - PubMed
-
- Back SA, Riddle A, Hohimer AR. Role of instrumented fetal sheep preparations in defining the pathogenesis of human periventricular white matter injury. J Child Neurol. 2006;21:582–589. - PubMed
Publication types
MeSH terms
Grants and funding
LinkOut - more resources
Full Text Sources
Other Literature Sources
Research Materials
Miscellaneous
