

The glutamine synthetase gene family in Populus
- PMID: 21867507
- PMCID: PMC3224142
- DOI: 10.1186/1471-2229-11-119
The glutamine synthetase gene family in Populus
Abstract
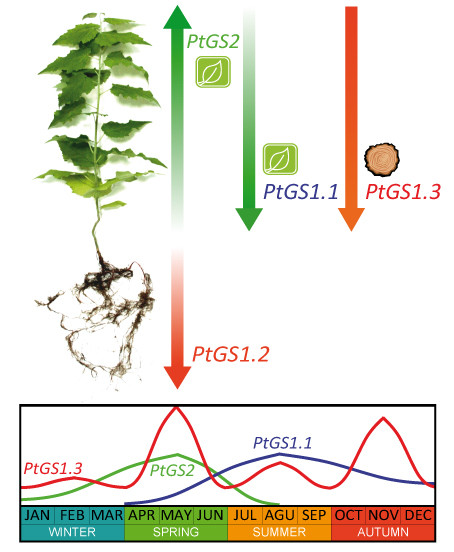
Background: Glutamine synthetase (GS; EC: 6.3.1.2, L-glutamate: ammonia ligase ADP-forming) is a key enzyme in ammonium assimilation and metabolism of higher plants. The current work was undertaken to develop a more comprehensive understanding of molecular and biochemical features of GS gene family in poplar, and to characterize the developmental regulation of GS expression in various tissues and at various times during the poplar perennial growth.
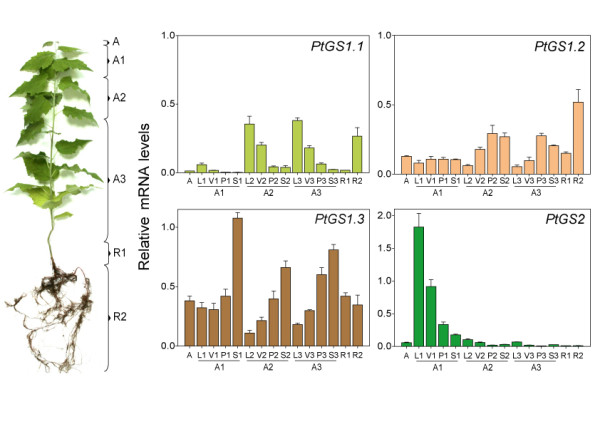
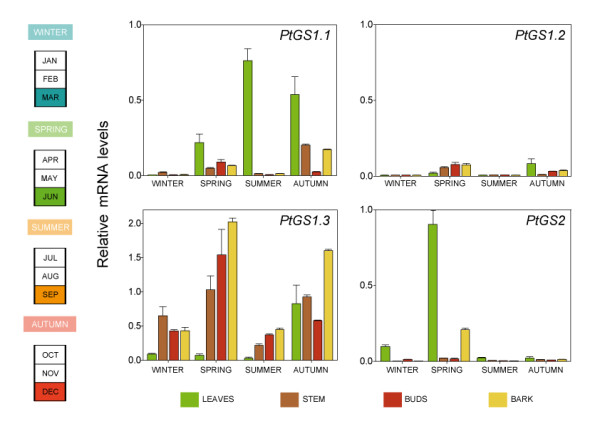
Results: The GS gene family consists of 8 different genes exhibiting all structural and regulatory elements consistent with their roles as functional genes. Our results indicate that the family members are organized in 4 groups of duplicated genes, 3 of which code for cytosolic GS isoforms (GS1) and 1 which codes for the choroplastic GS isoform (GS2). Our analysis shows that Populus trichocarpa is the first plant species in which it was observed the complete GS family duplicated. Detailed expression analyses have revealed specific spatial and seasonal patterns of GS expression in poplar. These data provide insights into the metabolic function of GS isoforms in poplar and pave the way for future functional studies.
Conclusions: Our data suggest that GS duplicates could have been retained in order to increase the amount of enzyme in a particular cell type. This possibility could contribute to the homeostasis of nitrogen metabolism in functions associated to changes in glutamine-derived metabolic products. The presence of duplicated GS genes in poplar could also contribute to diversification of the enzymatic properties for a particular GS isoform through the assembly of GS polypeptides into homo oligomeric and/or hetero oligomeric holoenzymes in specific cell types.
Figures


Similar articles
-
Redundancy and metabolic function of the glutamine synthetase gene family in poplar.BMC Plant Biol. 2015 Jan 22;15:20. doi: 10.1186/s12870-014-0365-5. BMC Plant Biol. 2015. PMID: 25608602 Free PMC article.
-
Response of transgenic poplar overexpressing cytosolic glutamine synthetase to phosphinothricin.Phytochemistry. 2008 Jan;69(2):382-9. doi: 10.1016/j.phytochem.2007.07.031. Epub 2007 Sep 20. Phytochemistry. 2008. PMID: 17888468
-
Mineral nitrogen sources differently affect root glutamine synthetase isoforms and amino acid balance among organs in maize.BMC Plant Biol. 2015 Apr 3;15:96. doi: 10.1186/s12870-015-0482-9. BMC Plant Biol. 2015. PMID: 25886826 Free PMC article.
-
Glutamine synthetase: an unlikely case of functional redundancy in Arabidopsis thaliana.Plant Biol (Stuttg). 2022 Aug;24(5):713-720. doi: 10.1111/plb.13408. Epub 2022 Mar 4. Plant Biol (Stuttg). 2022. PMID: 35246892 Review.
-
Structural property, molecular regulation, and functional diversity of glutamine synthetase in higher plants: a data-mining bioinformatics approach.Plant J. 2021 Dec;108(6):1565-1584. doi: 10.1111/tpj.15536. Epub 2021 Oct 31. Plant J. 2021. PMID: 34628690 Review.
Cited by
-
Reassimilation of Photorespiratory Ammonium in Lotus japonicus Plants Deficient in Plastidic Glutamine Synthetase.PLoS One. 2015 Jun 19;10(6):e0130438. doi: 10.1371/journal.pone.0130438. eCollection 2015. PLoS One. 2015. PMID: 26091523 Free PMC article.
-
Overexpression of a pine Dof transcription factor in hybrid poplars: A comparative study in trees growing under controlled and natural conditions.PLoS One. 2017 Apr 4;12(4):e0174748. doi: 10.1371/journal.pone.0174748. eCollection 2017. PLoS One. 2017. PMID: 28376100 Free PMC article.
-
Redundancy and metabolic function of the glutamine synthetase gene family in poplar.BMC Plant Biol. 2015 Jan 22;15:20. doi: 10.1186/s12870-014-0365-5. BMC Plant Biol. 2015. PMID: 25608602 Free PMC article.
-
Wheat glutamine synthetase TaGSr-4B is a candidate gene for a QTL of thousand grain weight on chromosome 4B.Theor Appl Genet. 2022 Jul;135(7):2369-2384. doi: 10.1007/s00122-022-04118-8. Epub 2022 May 19. Theor Appl Genet. 2022. PMID: 35588016 Free PMC article.
-
Three cytosolic glutamine synthetase isoforms localized in different-order veins act together for N remobilization and seed filling in Arabidopsis.J Exp Bot. 2018 Aug 14;69(18):4379-4393. doi: 10.1093/jxb/ery217. J Exp Bot. 2018. PMID: 29873769 Free PMC article.
References
-
- Lea PJ, Ireland RJ. In: Plant Amino Acids, Biochemistry and Biotechnology. Marcel Dekker, New York. BK Singh, editor. 1999. Nitrogen metabolism in higher plants; pp. 1–47.
-
- Forde BG, Cullimore JV. The molecular biology of glutamine synthetase in higher plants. Oxford Surveys in Plant Molecular and Cell Biology. 1989;6:115–128.
-
- Seabra AR, Carvalho H, Pereira PJB. Crystallization and preliminary crystallographic characterization of glutamine synthetase from Medicago truncatula. Acta Crystallographica Section F Structural Biology and Crystallization Communications. 2009;65:1309–1312. doi: 10.1107/S1744309109047381. - DOI - PMC - PubMed
Publication types
MeSH terms
Substances
LinkOut - more resources
Full Text Sources
Other Literature Sources
