

doi: 10.1186/1742-4682-8-30.
Cancer as a dynamical phase transition
Affiliations
- PMID: 21867509
- PMCID: PMC3177875
- DOI: 10.1186/1742-4682-8-30
Item in Clipboard
Cancer as a dynamical phase transition
Theor Biol Med Model.
.
Abstract
This paper discusses the properties of cancer cells from a new perspective based on an analogy with phase transitions in physical systems. Similarities in terms of instabilities and attractor states are outlined and differences discussed. While physical phase transitions typically occur at or near thermodynamic equilibrium, a normal-to-cancer (NTC) transition is a dynamical non-equilibrium phenomenon, which depends on both metabolic energy supply and local physiological conditions. A number of implications for preventative and therapeutic strategies are outlined.
Figures
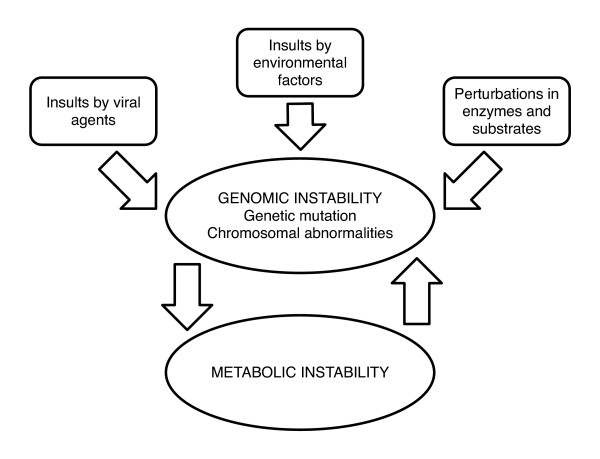
Schematic diagram of external effects on cancel cell instabilities.
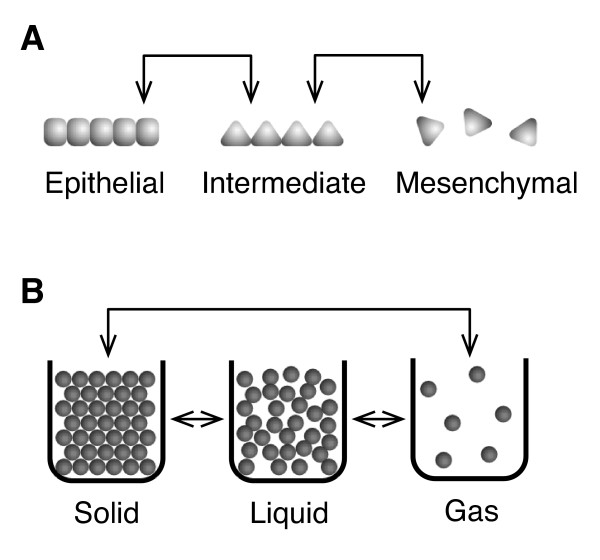
Illustrations comparing structural changes in biological and physical systems undergoing phase transitions. Comparison between (a) an epithelial-to-mesenchymal (ETM) phase transition, and (b) phase transitions between solids, liquids, and gases [27].
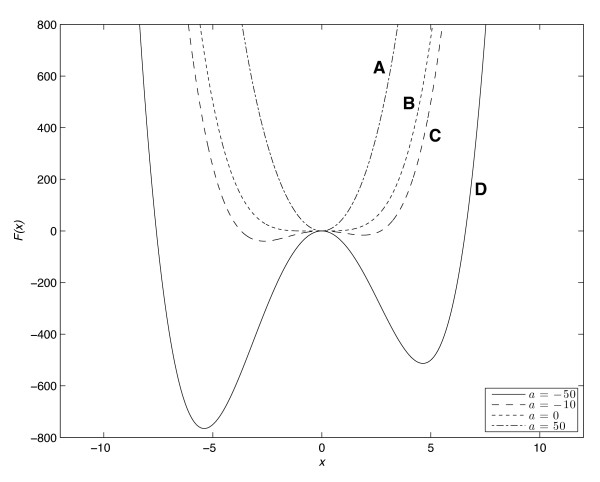
Potential energy landscapes of the normal-to-cancer (NTC) phase transition model. The free energy function F(x) = x4 + 3x3 + ax2 of the order parameter x is plotted with different values for the control parameter a.
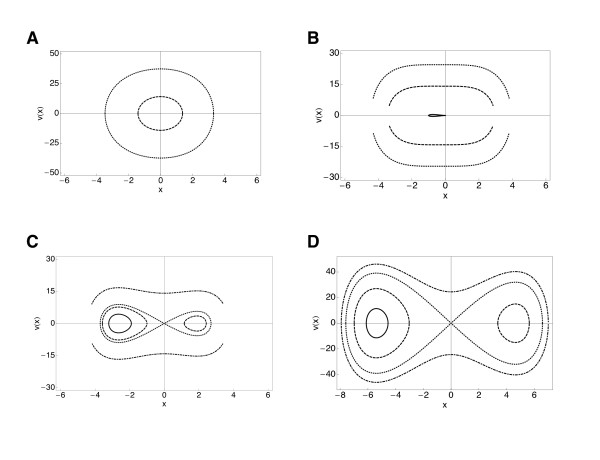
Phase portraits for the normal-to-cancer (NTC) phase transition model. Phase portraits for four different values of a. Panel A shows a = -50, E = -700, -400, 0, 300. Panel B shows a = -10, E = -30, -10, 0, 100. Panel C shows a = 0, E = 0, 100, 300. Panel D shows a = 50, E = 0, 300, 700.
References
-
- Weinberg RA. The Biology of Cancer. New York: Garland Science; 2007.
-
- Smith A-S. Physics challenged by cells. Nature Physics. 2010;6:726–729. doi: 10.1038/nphys1798. - DOI
-
- Molecular Biology of the Cell. 3. New York: Garland Pub; 1994.
Publication types
MeSH terms
Grants and funding
LinkOut - more resources
Full Text Sources
