Comparative Study
. 2011 Aug 26:12:434.
doi: 10.1186/1471-2164-12-434.

Analysis of human meiotic recombination events with a parent-sibling tracing approach

Affiliations
Comparative Study

Analysis of human meiotic recombination events with a parent-sibling tracing approach

Yun-Shien Lee et al. BMC Genomics. .

Abstract

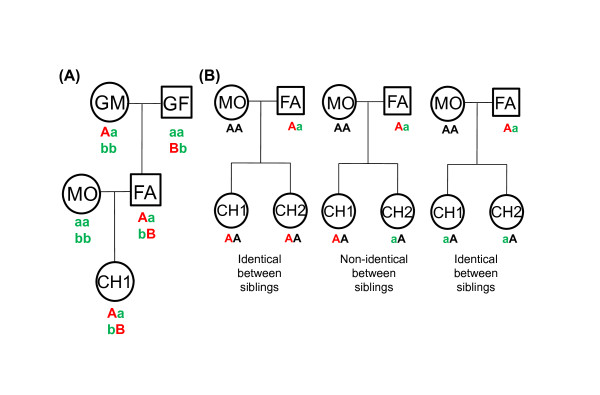
Background: Meiotic recombination ensures that each child inherits distinct genetic materials from each parent, but the distribution of crossovers along meiotic chromosomes remains difficult to identify. In this study, we developed a parent-sibling tracing (PST) approach from previously reported methods to identify meiotic crossover sites of GEO GSE6754 data set. This approach requires only the single nucleotide polymorphism (SNP) data of the pedigrees of both parents and at least two of children.

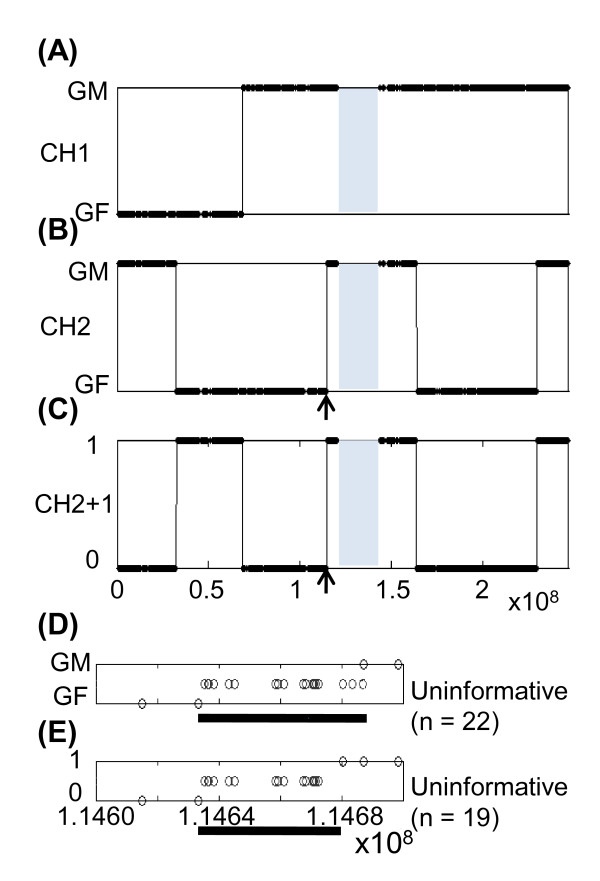
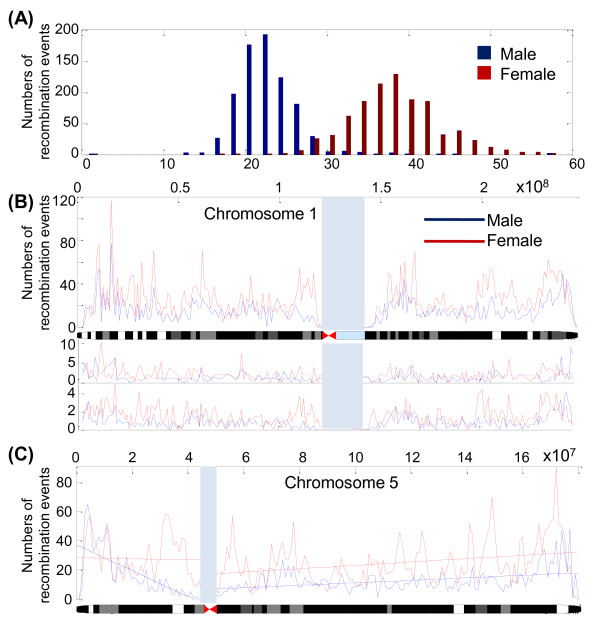
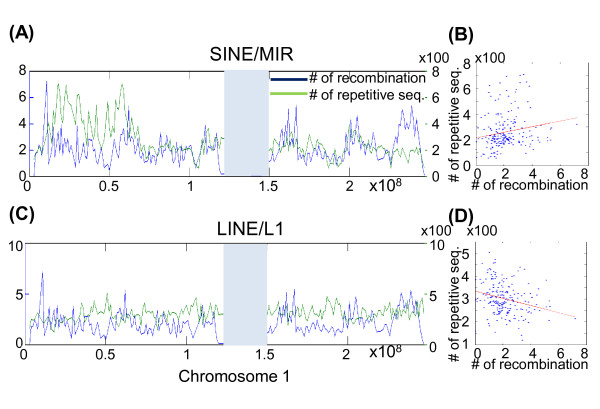
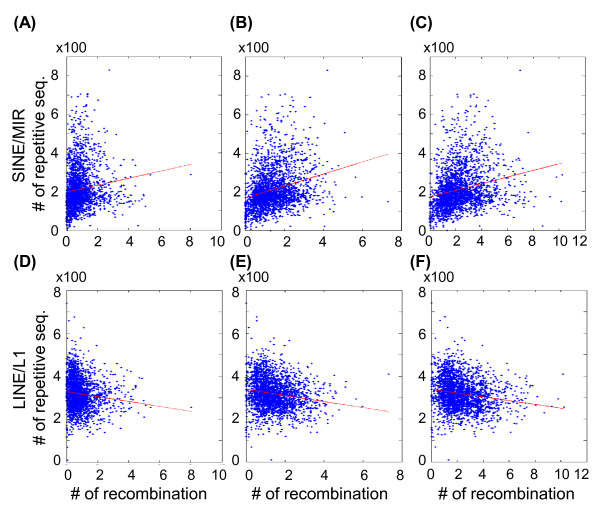
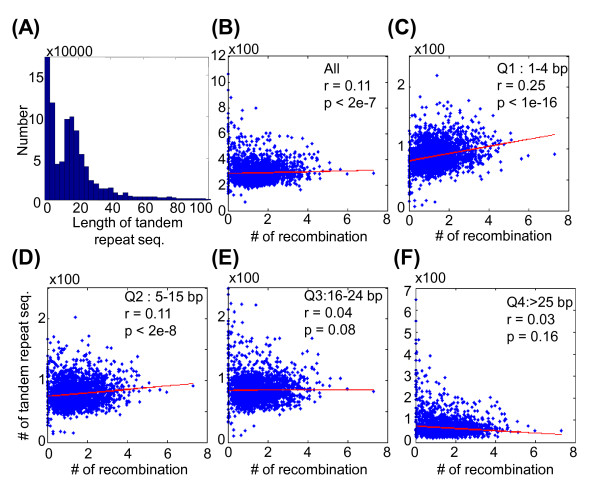
Results: Compared to other SNP-based algorithms (identity by descent or pediSNP), fewer uninformative SNPs were derived with the use of PST. Analysis of a GEO GSE6754 data set containing 2,145 maternal and paternal meiotic events revealed that the pattern and distribution of paternal and maternal recombination sites vary along the chromosomes. Lower crossover rates near the centromeres were more prominent in males than in females. Based on analysis of repetitive sequences, we also showed that recombination hotspots are positively correlated with SINE/MIR repetitive elements and negatively correlated with LINE/L1 elements. The number of meiotic recombination events was positively correlated with the number of shorter tandem repeat sequences.

Conclusions: The advantages of the PST approach include the ability to use only two-generation pedigrees with two siblings and the ability to perform gender-specific analyses of repetitive elements and tandem repeat sequences while including fewer uninformative SNP regions in the results.


Figures

Figure 1
Figure 1
Different types of pedigrees are required for determining meiotic recombination sites by various methods. (A) Three-generation pedigrees are required for the identity by descent (IBD) method, and (B) complete two-generation pedigree for the parent-sibling tracing (PST) method. In the IBD method, the 'A' and 'B' allele in child 1 were required to originate from grandmother and grandfather, respectively. In PST approach, the paternal genotype was 'Aa' and the maternal genotype was 'AA', children with 'Aa' and 'aa' were coded as "0: not identical between siblings". If both children were 'Aa' and 'Aa' [or ('AA' and 'AA')], they were coded as "1: identical between siblings", (identical genotype origin for both children). Abbreviations: GF, grandfather; GM, grandmother; FA, father; MO, mother; CH1 and CH2, child 1 and child 2.
Figure 2
Figure 2
The paternal recombination site on chromosome 1 of child 1 and 2 (CH1 and CH2, defined in Figure 1) in the GMRCL dataset were defined using the identity by descent (IBD) (A, B, D) and parent-sibling tracing (PST) (C, E) methods. The grandmother and grandfather origin of paternal recombination is indicated as GM and GF, respectively. Children with identical or not identical origin are indicated as 1 and 0, respectively. Panels D and E are the enlarged view of the 114.6 -114.7 kb region on chromosome 1 shown in panels B and C, respectively, which are indicated by the black arrows. D and E: the SNP sites (open circles) that could not be mapped to either GF or GM in the IBD method, or to either an identical or non-identical status using the PST approach, are indicated as a uninformative SNPs. The calling schema of IBD and PST methods is shown in Additional File 1. The chromosomal regions without any SNP site in the Affymetrix Genome-Wide Human SNP 6.0 arrays are marked as gray blocks (A to C).
Figure 3
Figure 3
Distribution of the 2,145 paternal and 2,145 maternal recombination events across all human autosomal chromosomes (A), chromosome 1 (B) and chromosome 6 (C). (A) The distribution of the numbers of the paternal (blue bar) and maternal (red bar) recombination events across autosomal chromosomes. (B) The number of recombination sites for chromosome 1 was calculated using a window width of 1 Mb. The middle and lower panel of the Figure 3B are the Marshfield recombination map and Icelandic recombination map, respectively. The maternal (red) and paternal (blue) genetic distance for each 1-Mb window was calculated on the basis of the SNP position information provided by Affymetrix. We assumed a constant crossover rate between two adjacent SNP markers. The physical position and the chromosome ideogram are shown on the top and bottom of the figure, respectively. (C) The regression lines for maternal (red) and paternal (blue) crossover rates corresponding to the distance from the centromere are shown, using chromosome 6 as an example. The slope was significantly different from zero in the p arm of male but not in female chromosomes. In contrast, both genders showed a significant correlation in the number of recombination sites towards the telomere of the q arm. The chromosomal regions without any SNP site in the Affymetrix Genome-Wide Human SNP 6.0 arrays are marked as gray blocks.
Figure 4
Figure 4
Correlation between the number of sex-averaged recombination sites and SINE/MIR (A, B) or LINE/L1 (C, D) repetitive sequences elements. The distribution of the number of sex-averaged recombination sites (blue) and repetitive sequences elements (green) on chromosome 1 was calculated using a window width set to 1 Mb (A, C). The scatter plot shows the number of sex-averaged recombination sites and repetitive sequences on chromosome 1 (B, D). Regression lines are marked in red. The chromosomal regions without any SNP site in the Affymetrix Genome-Wide Human SNP 6.0 arrays are marked as gray blocks.
Figure 5
Figure 5
Scatter plot of the number of paternal (A, D), maternal (B, E), and sex-averaged (C, F) recombination sites for the SINE/MIR (A, B, C) and LINE/L1 (D, E, F) repetitive sequences on chromosome 1. Regression lines are marked in red.
Figure 6
Figure 6
(A) Distribution of the length of the 947,696 tandem repeats sequences. (B) Scatter plot of the number of maternal recombination sites and the number of tandem repeat sequences. When the tandem repeat sequences are grouped into 4 quartiles according to the length of repeat sequences, scatter plots for each quartile are shown in (C) Q1, 1-4 base pairs (bp), (D) Q2, 5-15 bp, (E) Q3, 16-24 bp, and (F) Q4, larger than 25 bp, respectively. Regression lines are marked in red, and the Pearson correlation coefficients between number of maternal recombination events and the number of tandem repeat sequences are indicated.

References

    1. Alberts B, Johnson A, Lewis J, Raff M, Roberts K, Walter P. Molecular Biology of THE CELL. 5. New York: Garland Science; 2008.
    1. Martinez-Perez E, Colaiacovo MP. Distribution of meiotic recombination events: talking to your neighbors. Curr Opin Genet Dev. 2009;12:105–112. doi: 10.1016/j.gde.2009.02.005. - DOI - PMC - PubMed
    1. Parvanov ED, Petkov PM, Paigen K. Prdm9 controls activation of mammalian recombination hotspots. Science. 2010;12:835. doi: 10.1126/science.1181495. - DOI - PMC - PubMed
    1. Baudat F, Buard J, Grey C, Fledel-Alon A, Ober C, Przeworski M, Coop G, de Massy B. PRDM9 is a major determinant of meiotic recombination hotspots in humans and mice. Science. 2010;12:836–840. doi: 10.1126/science.1183439. - DOI - PMC - PubMed
    1. Myers S, Bowden R, Tumian A, Bontrop RE, Freeman C, MacFie TS, McVean G, Donnelly P. Drive against hotspot motifs in primates implicates the PRDM9 gene in meiotic recombination. Science. 2010;12:876–879. doi: 10.1126/science.1182363. - DOI - PMC - PubMed

Publication types

Associated data

LinkOut - more resources