Evaluation of two commercial global miRNA expression profiling platforms for detection of less abundant miRNAs
- PMID: 21867561
- PMCID: PMC3184117
- DOI: 10.1186/1471-2164-12-435
Evaluation of two commercial global miRNA expression profiling platforms for detection of less abundant miRNAs
Abstract
Background: microRNAs (miRNA) are short, endogenous transcripts that negatively regulate the expression of specific mRNA targets. miRNAs are found both in tissues and body fluids such as plasma. A major perspective for the use of miRNAs in the clinical setting is as diagnostic plasma markers for neoplasia. While miRNAs are abundant in tissues, they are often scarce in plasma. For quantification of miRNA in plasma it is therefore of importance to use a platform with high sensitivity and linear performance in the low concentration range. This motivated us to evaluate the performance of three commonly used commercial miRNA quantification platforms: GeneChip miRNA 2.0 Array, miRCURY Ready-to-Use PCR, Human panel I+II V1.M, and TaqMan Human MicroRNA Array v3.0.
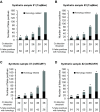
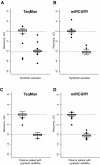
Results: Using synthetic miRNA samples and plasma RNA samples spiked with different ratios of 174 synthetic miRNAs we assessed the performance characteristics reproducibility, recovery, specificity, sensitivity and linearity. It was found that while the qRT-PCR based platforms were sufficiently sensitive to reproducibly detect miRNAs at the abundance levels found in human plasma, the array based platform was not. At high miRNA levels both qRT-PCR based platforms performed well in terms of specificity, reproducibility and recovery. At low miRNA levels, as in plasma, the miRCURY platform showed better sensitivity and linearity than the TaqMan platform.
Conclusion: For profiling clinical samples with low miRNA abundance, such as plasma samples, the miRCURY platform with its better sensitivity and linearity would probably be superior.
Figures


Similar articles
-
Reproducibility of quantitative RT-PCR array in miRNA expression profiling and comparison with microarray analysis.BMC Genomics. 2009 Aug 28;10:407. doi: 10.1186/1471-2164-10-407. BMC Genomics. 2009. PMID: 19715577 Free PMC article.
-
Cross-platform analysis of global microRNA expression technologies.BMC Genomics. 2010 May 26;11:330. doi: 10.1186/1471-2164-11-330. BMC Genomics. 2010. PMID: 20504329 Free PMC article.
-
Variability in microRNA recovery from plasma: Comparison of five commercial kits.Anal Biochem. 2015 Nov 1;488:28-35. doi: 10.1016/j.ab.2015.07.018. Epub 2015 Aug 10. Anal Biochem. 2015. PMID: 26271186
-
MicroRNA (miRNA) Profiling.Methods Mol Biol. 2016;1381:151-61. doi: 10.1007/978-1-4939-3204-7_8. Methods Mol Biol. 2016. PMID: 26667459 Review.
-
Strategies for profiling microRNA expression.J Cell Physiol. 2009 Jan;218(1):22-5. doi: 10.1002/jcp.21577. J Cell Physiol. 2009. PMID: 18767038 Review.
Cited by
-
Circulating Plasma microRNAs can differentiate Human Sepsis and Systemic Inflammatory Response Syndrome (SIRS).Sci Rep. 2016 Jun 20;6:28006. doi: 10.1038/srep28006. Sci Rep. 2016. PMID: 27320175 Free PMC article.
-
miRNome expression analysis in canine diffuse large B-cell lymphoma.Front Oncol. 2023 Aug 30;13:1238613. doi: 10.3389/fonc.2023.1238613. eCollection 2023. Front Oncol. 2023. PMID: 37711209 Free PMC article.
-
Assessment of a Serum Microrna Risk Score for Colorectal Cancer among Participants of Screening Colonoscopy at Various Stages of Colorectal Carcinogenesis.Cells. 2022 Aug 8;11(15):2462. doi: 10.3390/cells11152462. Cells. 2022. PMID: 35954306 Free PMC article.
-
miR-758-3p: a blood-based biomarker that's influence on the expression of CERP/ABCA1 may contribute to the progression of obesity to metabolic syndrome.Oncotarget. 2018 Jan 24;9(10):9379-9390. doi: 10.18632/oncotarget.24314. eCollection 2018 Feb 6. Oncotarget. 2018. PMID: 29507696 Free PMC article.
-
Probable impact of age and hypoxia on proliferation and microRNA expression profile of bone marrow-derived human mesenchymal stem cells.PeerJ. 2016 Jan 14;4:e1536. doi: 10.7717/peerj.1536. eCollection 2016. PeerJ. 2016. PMID: 26788424 Free PMC article.
References
-
- Mitchell PS, Parkin RK, Kroh EM, Fritz BR, Wyman SK, Pogosova-Agadjanyan EL, Peterson A, Noteboom J, O'Briant KC, Allen A, Lin DW, Urban N, Drescher CW, Knudsen BS, Stirewalt DL, Gentleman R, Vessella RL, Nelson PS, Martin DB, Tewari M. Circulating microRNAs as stable blood-based markers for cancer detection. Proc Natl Acad Sci USA. 2008;105:10513–10518. doi: 10.1073/pnas.0804549105. - DOI - PMC - PubMed
Publication types
MeSH terms
Substances
LinkOut - more resources
Full Text Sources
Other Literature Sources

