. 2011 Aug 26;35(2):236-48.
doi: 10.1016/j.immuni.2011.06.012.

CD8α(+) dendritic cells are an obligate cellular entry point for productive infection by Listeria monocytogenes

Affiliations

CD8α(+) dendritic cells are an obligate cellular entry point for productive infection by Listeria monocytogenes

Brian T Edelson et al. Immunity. .

Abstract

CD8α(+) dendritic cells (DCs) prime cytotoxic T lymphocytes during viral infections and produce interleukin-12 in response to pathogens. Although the loss of CD8α(+) DCs in Batf3(-/-) mice increases their susceptibility to several pathogens, we observed that Batf3(-/-) mice exhibited enhanced resistance to the intracellular bacterium Listeria monocytogenes. In wild-type mice, Listeria organisms, initially located in the splenic marginal zone, migrated to the periarteriolar lymphoid sheath (PALS) where they grew exponentially and induced widespread lymphocyte apoptosis. In Batf3(-/-) mice, however, Listeria organisms remain trapped in the marginal zone, failed to traffic into the PALS, and were rapidly cleared by phagocytes. In addition, Batf3(-/-) mice, which lacked the normal population of hepatic CD103(+) peripheral DCs, also showed protection from liver infection. These results suggest that Batf3-dependent CD8α(+) and CD103(+) DCs provide initial cellular entry points within the reticuloendothelial system by which Listeria establishes productive infection.


Figures

Figure 1
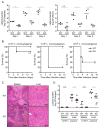
Figure 1. Batf3−/− mice are resistant to Listeria infection
(A) Listeria CFUs per spleen and liver of wild type (WT) and Batf3−/− (KO) mice infected with 2.5×10⁴ L. monocytogenes i.v. Circles represent individual mice. Lines represent the mean log CFU/organ. Four to five mice per group per time point. *p ≤ 0.05. (B) Survival of mice infected with three different doses of L. monocytogenes i.v. Five mice per group. *p ≤ 0.05. (C) Histopathology (H&E) of infected spleens and livers from mice three days after infection (2.5×10⁴ L. monocytogenes i.v.). Spleen scale bars 200 microns, liver scale bars 50 microns. (D) Listeria CFUs per spleen and liver in mice two days after infection with the indicated dose of L. ivanovii i.v. Lines represent the mean log CFU/organ. Limit of detection is 100 CFU/organ. Data are compiled from two independent experiments at each dose (six to eight mice/group). *p ≤ 0.05.
Figure 2
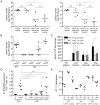
Figure 2. Neutrophils and endogenous type I interferon function normally in Batf3−/− mice during Listeria infection
(A) Listeria CFUs per spleen and liver three days after infection in WT and Batf3−/− (KO) mice. Mice were treated with rat IgG or anti-Ly6G neutrophil-depleting antibody i.p. one day prior to infection with 1×10⁴ L. monocytogenes i.v. Circles represent individual mice. Lines represent the mean log CFU/organ. Limit of detection is 100 CFU/organ. Data are compiled from two independent experiments. *p ≤ 0.05. (B) Listeria CFUs per spleen and liver at day three post-infection in WT and KO mice. Mice were treated with saline or poly I:C i.v. at the time of infection with 2.5×10⁴ L. monocytogenes i.v. Lines represent the mean log CFU/organ. Limit of detection is 100 CFU/organ. *p ≤ 0.05. (C) Listeria CFUs per spleen and liver at day three post-infection in WT and Batf3−/− (KO) mice. Mice were treated with isotype control mouse IgG1 monoclonal antibody or anti-IFNAR-1 antibody i.p. one day prior to infection with 2.5×10⁴ (WT) or 5×10⁵ (KO) L. monocytogenes i.v. Lines represent the mean log CFU/organ. *p ≤ 0.05.
Figure 3
Figure 3. T cell responses to Listeria in Batf3−/− mice
(A) Listeria CFUs per spleen and liver three days after infection in WT mice. Mice received either no cell transfer, or the transfer of 20 million splenocytes from either naïve WT mice, or WT or Batf3−/− (KO) mice that had survived sublethal infection with 1×10⁴ L. monocytogenes (day 51 post-sublethal infection) one day prior to infection with 2.5×10⁴ L. monocytogenes i.v. Circles represent individual mice. Lines represent the mean log CFU/organ. *p ≤ 0.05. (B) Listeria CFUs per spleen at day three after infection in WT or Batf3−/− (KO) mice infected with the indicated dose of Lm-Ova i.v. Lines represent the mean log CFU/organ. (C) T cell recall responses at day 8 post-infection in WT or Batf3−/− (KO) mice infected with the indicated dose of Lm-Ova measured in an IFNγ ELISPOT assay. Cells were restimulated with either no antigen, the CD4 epitope LLO190–201, the CD4 epitope Ova323–339, or the CD8 epitope Ova257–264. (D) CD8 T cell responses measured at day 7 or 8 post-infection following the indicated doses of Lm-Ova i.v. in WT or Batf3−/− (KO) mice, measured as the percentage of B220CD4CD8+ T cells showing positive staining with Kb-SIINFEKL-pentamer. Lines represent the mean percentage. Data are compiled from two independent experiments. (E) OT-I T cell number/spleen at days 3, 7, and 31 post-infection following the indicated doses of Lm-Ova i.v. in WT or Batf3−/− (KO) mice. 6×10⁵ OT-I+Rag1−/−CD45.1+ T cells were transferred one day prior to infection. OT-I T cells were identified by flow cytometry as Vα2 TCR+CD45.1+ cells.
Figure 4
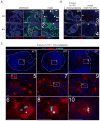
Figure 4. Immunostaining of splenic Langerin+ DCs and Listeria
(A) Sections of uninfected WT and Batf3−/− (KO) spleens were stained for B220 (blue), Langerin (red) and CD11c (green). Arrows indicate cells (yellow) co-expressing Langerin and CD11c. Dashed lines indicate the border between follicle and red pulp. Numbered regions in low power views are shown at higher magnification in the labeled insets. Scale bars are 200 microns in low power images, and 50 microns in insets. (B) Sections of infected WT and Batf3−/− (KO) spleens were stained for B220 (blue), Langerin (red) and Listeria (green). Arrows indicate cells Langerin+ cells co-localizing with Listeria. Scale bars are 200 microns in low power images, and 50 microns in insets. (C) Sections of infected WT spleens were stained as in (B). Shown are three examples of Langerin+ DCs containing Listeria organisms. Scale bars are 50 microns in the low magnification images and 10 microns in medium and high magnification images.
Figure 5
Figure 5. Immunostaining of splenic Listeria infection
(A) Sections of WT and Batf3−/− (KO) spleens infected at the indicated inocula were harvested at the indicated time after infection and stained for B220 (blue), CD3e (red) and Listeria (green). Dashed lines indicate the border between follicle and red pulp. Numbered regions in low power views are shown at higher magnification in the labeled insets. (B) Sections of WT and Batf3−/− (KO) spleens infected at the indicated inocula were harvested at the indicated time after infection and stained for B220 (blue), Ly6G (red) and Listeria (green). Dashed lines indicate the border between follicle and red pulp. Numbered regions in low power views are shown at higher magnification in the labeled insets. Scale bars are 200 microns in low power images, and 50 microns in insets.
Figure 6
Figure 6. Flow cytometry identifies Listeria-infected cells
Flow cytometry of WT and Batf3−/− (KO) splenocytes from uninfected and infected mice at 18 hours after infection at the indicated inocula was performed with anti-Listeria antibody and (A) Ly6C and Ly6G to identify PMNs, (B) Ly6C and CD11b to identify inflammatory monocytes, and (C) CD11c, Ly6C, Ly6G, CD8α, and CD205 to identify cDCs. Numbers represent the percentage of cells within the indicated gates.
Figure 7
Figure 7. Flow cytometry identifies cells infected with LLO-deficient L. monocytogenes
Flow cytometry of WT and Batf3−/− (KO) splenocytes from uninfected and infected mice at 18 hours after infections at the indicated inocula of LLO-deficient L. monocytogenes was performed with anti-Listeria antibody and (A) CD11c, B220, CD8α, and Langerin to identify cDCs, or (B) Ly6C and Ly6G to identify PMNs. Numbers represent the percentage of cells within the indicated gates.

Comment in

References

    1. Alaniz RC, Sandall S, Thomas EK, Wilson CB. Increased dendritic cell numbers impair protective immunity to intracellular bacteria despite augmenting antigen-specific CD8+ T lymphocyte responses. J Immunol. 2004;172:3725–3735. - PubMed
    1. Aliberti J, Schulz O, Pennington DJ, Tsujimura H, Sousa Reis E, Ozato K, Sher A. Essential role for ICSBP in the in vivo development of murine CD8alpha + dendritic cells. Blood. 2003;101:305–310. - PubMed
    1. Aoshi T, Carrero JA, Konjufca V, Koide Y, Unanue ER, Miller MJ. The cellular niche of Listeria monocytogenes infection changes rapidly in the spleen. Eur J Immunol. 2009;39:417–425. - PMC - PubMed
    1. Aoshi T, Zinselmeyer BH, Konjufca V, Lynch JN, Zhang X, Koide Y, Miller MJ. Bacterial entry to the splenic white pulp initiates antigen presentation to CD8+ T cells. Immunity. 2008;29:476–486. - PubMed
    1. Auerbuch V, Brockstedt DG, Meyer-Morse N, O’Riordan M, Portnoy DA. Mice lacking the type I interferon receptor are resistant to Listeria monocytogenes. J Exp Med. 2004;200:527–533. - PMC - PubMed

Publication types

MeSH terms