. 2011 Nov 11;286(45):39259-68.
doi: 10.1074/jbc.M111.255489. Epub 2011 Aug 25.

Involvement of 14-3-3 proteins in the second epidermal growth factor-induced wave of Rac1 activation in the process of cell migration

Affiliations

Involvement of 14-3-3 proteins in the second epidermal growth factor-induced wave of Rac1 activation in the process of cell migration

Hiroki Kobayashi et al. J Biol Chem. .

Abstract

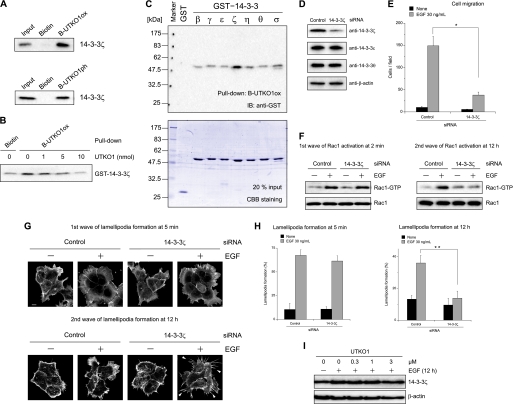
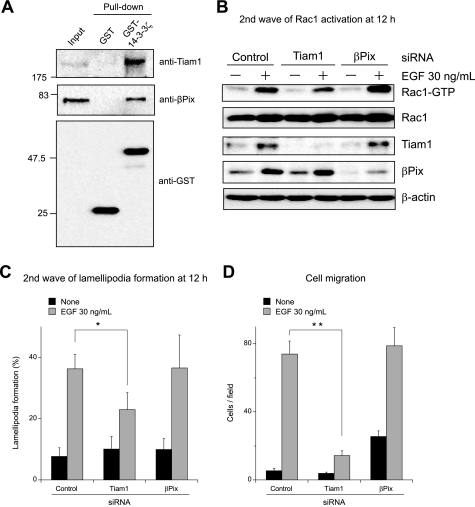
Immense previous efforts have elucidated the core machinery in cell migration, actin remodeling regulated by Rho family small GTPases including RhoA, Cdc42, and Rac1; however, the spatiotemporal regulation of these molecules remains largely unknown. Here, we report that EGF induces biphasic Rac1 activation in the process of cell migration, and UTKO1, a cell migration inhibitor, inhibits the second EGF-induced wave of Rac1 activation but not the first wave. To address the regulation mechanism and role of the second wave of Rac1 activation, we identified 14-3-3ζ as a target protein of UTKO1 and also showed that UTKO1 abrogated the binding of 14-3-3ζ to Tiam1 that was responsible for the second wave of Rac1 activation, suggesting that the interaction of 14-3-3ζ with Tiam1 is involved in this event. To our knowledge, this is the first report to use a chemical genetic approach to demonstrate the mechanism of temporal activation of Rac1.


Figures

FIGURE 1.
FIGURE 1.
UTKO1 inhibits the second EGF-induced wave of lamellipodia formation in A431 cells. A and B, EGF-induced lamellipodia formation in A431 cells, observed under confocal microscopy (A) and counted (B). C, structure of UTKO1. D–G, effect of UTKO1 on EGF-induced lamellipodia formation. A431 cells were pretreated with the indicated concentrations of UTKO1 for 15 min and stimulated with EGF. After 5 min (D and E) or 12 h (F and G), the cells were observed under confocal microscopy (D and F) and counted (E and G). The data represent the means ± S.D. (n = 6). H, inhibitory activity of UTKO1 on EGF-induced cell migration, monitored using a chemotaxis chamber. The data represent the means ± S.D. (n = 5). Throughout, the data were representative of at least three independent studies. Arrows, lamellipodia; arrowheads, see text. Scale bar, 10 μm. For G, statistical analyses were performed with a two-tailed Student's t test. *, p = 0.00013; **, p = 1.0 × 10⁻⁵. For B, E, and G, more than 300 cells were analyzed per experiment.
FIGURE 2.
FIGURE 2.
UTKO1 inhibits the second EGF-induced wave of Rac1 activation in A431 cells. A, time course analysis of Rac1 activation following EGF stimulation. A431 cells were stimulated with EGF for the indicated periods, and then the cells were examined for active Rac1 by pulldown assay (upper panel); signal intensities of Rac1-GTP were quantified, normalized to total Rac1 expression, using Image J software (National Institutes of Health, lower panel). B and C, effect of UTKO1 on EGF-induced Rac1 activation. A431 cells were pretreated with UTKO1 for 12 h (B) or 15 min (C) and stimulated with EGF. Following 2 min (B) or 12 h (C) of incubation, the cells were examined for active Rac1 by pulldown assay. D–F, UTKO1 inhibits only the second wave of Rac1 activation. A431 cells were stimulated with EGF for 4 h, and then the cells were treated with 3 μm UTKO1. After a further 8 h of incubation, the cells were examined for active Rac1 by pulldown assay (D), or the cells with lamellipodia were counted (E). The data represent the means ± S.D. (n = 6). F, A431 cells were incubated in the upper chamber and stimulated with EGF. Following 4 h of incubation, the cells were treated with UTKO1. After a further 20 h of incubation, the migrated cells were counted. The data represent the means ± S.D. (n = 5). Throughout, the data were representative of at least three independent studies. For E, more than 300 cells were analyzed per experiment.
FIGURE 3.
FIGURE 3.
Identification of UTKO1 binding proteins. A, structures and bioactivities of B-UTKO1s. Bioactivities are shown as IC50 values in chemotaxis chamber assay and in lamellipodia formation assay. B, purification of UTKO1 binding proteins. Lysates of A431 cells stimulated with EGF for 4 h were incubated with biotin (50 nmol) or B-UTKO1ox (50 nmol) and avidin beads overnight. The beads were washed, and co-precipitated proteins were eluted with 2 mm biotin. The eluted proteins were subjected to SDS-PAGE followed by CBB staining. The co-precipitated proteins for B-UTKO1ox were identified as described under “Experimental Procedures.”
FIGURE 4.
FIGURE 4.
Identification of 14-3-3ζ as a target protein of UTKO1. A, confirmation of the binding of UTKO1 to 14-3-3ζ with Western blotting using anti-14-3-3ζ antibody. B, competition assay. Purified GST-tagged 14-3-3ζ (2.5 μg) was preincubated with UTKO1 as a competitor and was treated with biotin (0.5 nmol) or B-UTKO1ox (0.5 nmol) and avidin beads. The precipitated proteins were subjected to Western blotting using anti-GST antibody. C, determination of the binding ability of 14-3-3 isoforms to UTKO1. Purified GST or GST-tagged 14-3-3 isoforms were incubated with B-UTKO1ox and avidin beads. The precipitated proteins were subjected to Western blotting using anti-GST antibody (upper panel). GST or GST-tagged proteins used for the assay were subjected to SDS-PAGE followed by CBB staining as 20% input (lower panel). D–H, knockdown experiments. D, A431 cells were transfected with control or 14-3-3ζ siRNA and cultured for 72 h. Then the cells were collected and subjected to Western blotting using the indicated antibodies. E, control or 14-3-3ζ siRNA-transfected A431 cells were incubated in the upper chamber and stimulated with or without EGF for 24 h, and then the migrated cells were counted. The data represent the means ± S.D. (n = 5). F–H, control or 14-3-3ζ siRNA-transfected A431 cells were stimulated with EGF for 2 min or 12 h. Then the cells were examined for active Rac1 by pulldown assay (F), or the cells were observed under confocal microscopy (G), and counted (H). Arrowheads in G, see text. Scale bar, 10 μm. The data represent the means ± S.D. (n = 6). I, effect of UTKO1 on expression levels of 14-3-3ζ protein. A431 cells were pretreated with UTKO1 for 15 min and stimulated with EGF for 12 h. Then the cells were collected and subjected to Western blotting using the indicated antibodies. For E and H, statistical analyses were performed with a two-tailed Student's t test. *, p = 9.3 × 10⁻⁶; **, p = 3.3 × 10⁻⁷. Throughout, the data were representative of at least three independent studies. For H, more than 300 cells were analyzed per experiment. IB, immunoblot.
FIGURE 5.
FIGURE 5.
Identification of Tiam1 as a RacGEF which is responsible for the second EGF-induced wave of Rac1 activation. A, GST pulldown assay. Lysates of A431 cells stimulated with EGF for 12 h were incubated with GST or GST-14-3-3ζ and glutathione-Sepharose 4B. The precipitated proteins were subjected to Western blotting using the indicated antibodies. B–D, knockdown experiments. B and C, control, Tiam1, or βPix siRNA-transfected A431 cells were stimulated with EGF for 12 h. Then the cells were examined for active Rac1 by pulldown assay (B) or the cells with lamellipodia were counted (C). The data represent the means ± S.D. (n = 6). D, control, Tiam1, or βPix siRNA-transfected A431 cells were incubated in the upper chamber and stimulated with or without EGF for 24 h. Then the migrated cells were counted. The data represent the means ± S.D. (n = 5). For C and D, statistical analyses were performed with a two-tailed Student's t test. *, p = 0.0036; **, p = 5.9 × 10⁻⁹. Throughout, the data were representative of at least three independent studies. For C, more than 300 cells were analyzed per experiment.
FIGURE 6.
FIGURE 6.
UTKO1 inhibits the binding of 14-3-3ζ to Tiam1. A, GST pulldown assay. Lysates of A431 cells stimulated with EGF for 12 h were incubated with purified GST or GST-14-3-3ζ in the absence or presence of UTKO1. The binding proteins of GST or GST-14-3-3ζ precipitated with glutathione-Sepharose 4B were subjected to Western blotting using the indicated antibodies. B, immunoprecipitation assay. FLAG-14-3-3ζ-expressing A431 cells were transiently transfected with Tiam1–6×Myc. After 24 h, the cells were stimulated with EGF for 12 h in the absence or presence of UTKO1. The cells were lysed, and the protein complexes were precipitated with anti-FLAG antibody. The immunoprecipitants were subjected to Western blotting using the indicated antibodies. Throughout, the data were representative of at least three independent studies.

References

    1. Lauffenburger D. A., Horwitz A. F. (1996) Cell 84, 359–369 - PubMed
    1. Pollard T. D., Borisy G. G. (2003) Cell 112, 453–465 - PubMed
    1. Small J. V., Stradal T., Vignal E., Rottner K. (2002) Trends Cell Biol. 12, 112–120 - PubMed
    1. Yamazaki D., Suetsugu S., Miki H., Kataoka Y., Nishikawa S., Fujiwara T., Yoshida N., Takenawa T. (2003) Nature 424, 452–456 - PubMed
    1. Blanchoin L., Amann K. J., Higgs H. N., Marchand J. B., Kaiser D. A., Pollard T. D. (2000) Nature 404, 1007–1011 - PubMed

Publication types

MeSH terms