. 2011 Oct;25(10):1804-18.
doi: 10.1210/me.2011-1160. Epub 2011 Aug 25.

Residues within the transmembrane domain of the glucagon-like peptide-1 receptor involved in ligand binding and receptor activation: modelling the ligand-bound receptor

Affiliations

Residues within the transmembrane domain of the glucagon-like peptide-1 receptor involved in ligand binding and receptor activation: modelling the ligand-bound receptor

K Coopman et al. Mol Endocrinol. 2011 Oct.

Abstract

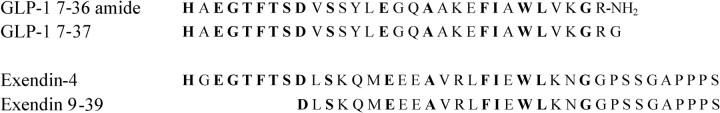
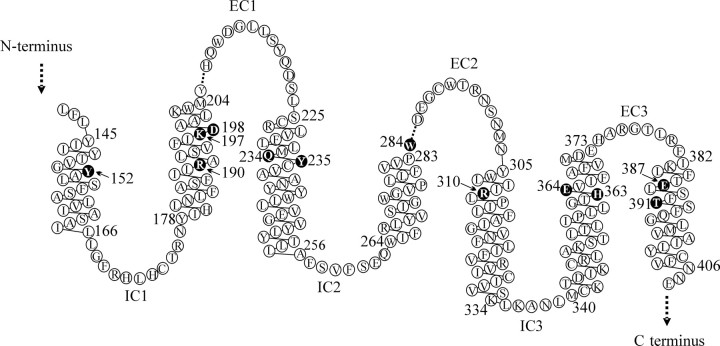
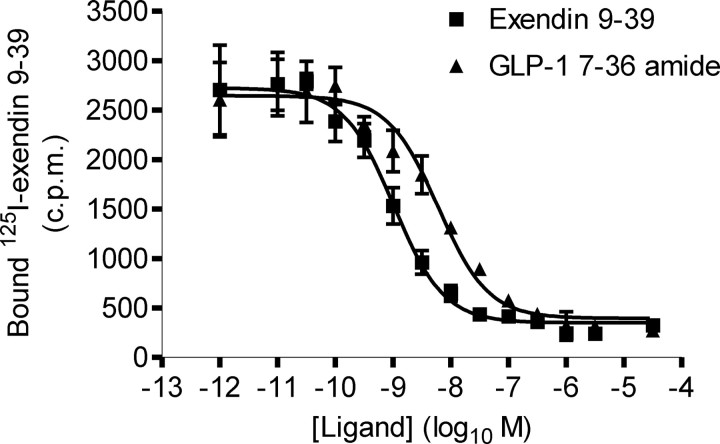
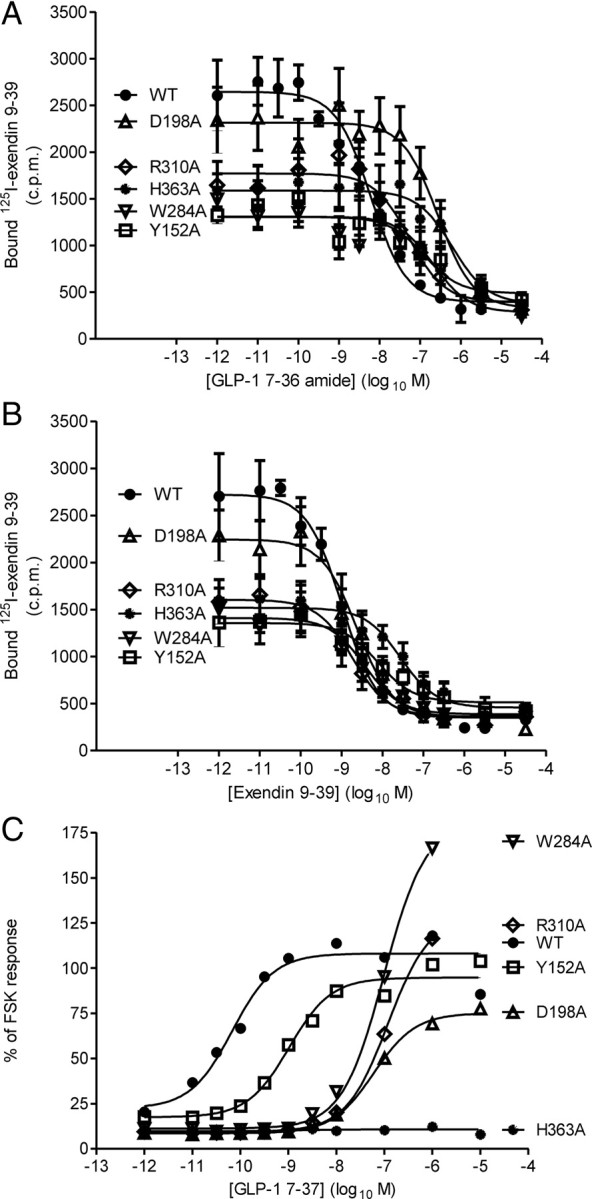
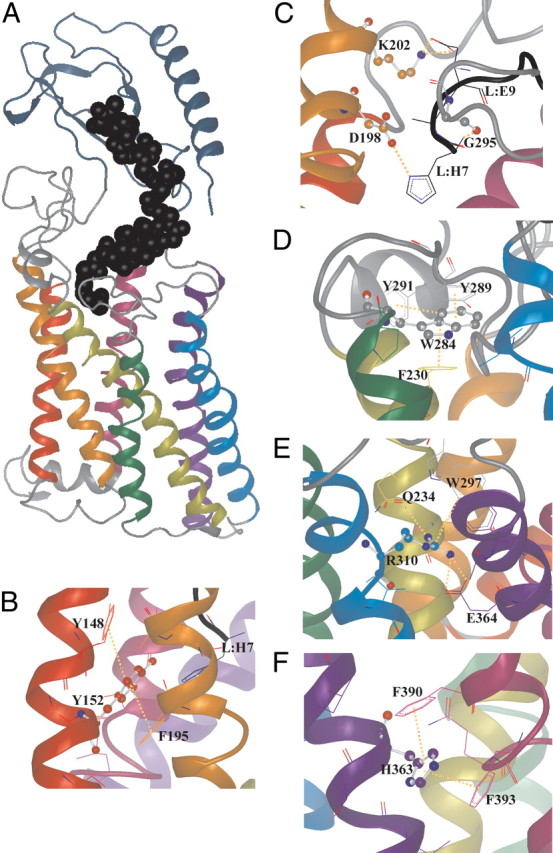
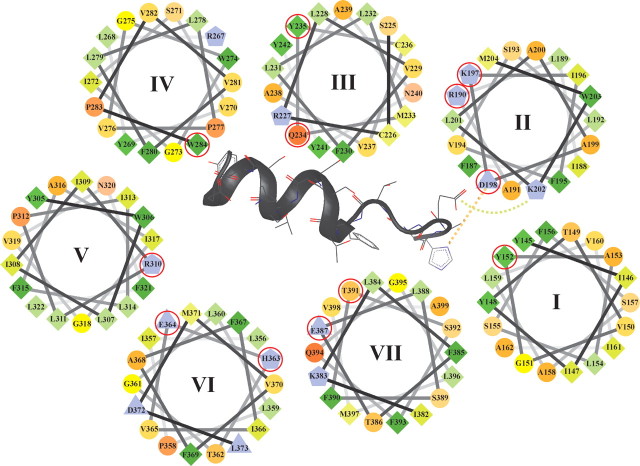
The C-terminal regions of glucagon-like peptide-1 (GLP-1) bind to the N terminus of the GLP-1 receptor (GLP-1R), facilitating interaction of the ligand N terminus with the receptor transmembrane domain. In contrast, the agonist exendin-4 relies less on the transmembrane domain, and truncated antagonist analogs (e.g. exendin 9-39) may interact solely with the receptor N terminus. Here we used mutagenesis to explore the role of residues highly conserved in the predicted transmembrane helices of mammalian GLP-1Rs and conserved in family B G protein coupled receptors in ligand binding and GLP-1R activation. By iteration using information from the mutagenesis, along with the available crystal structure of the receptor N terminus and a model of the active opsin transmembrane domain, we developed a structural receptor model with GLP-1 bound and used this to better understand consequences of mutations. Mutation at Y152 [transmembrane helix (TM) 1], R190 (TM2), Y235 (TM3), H363 (TM6), and E364 (TM6) produced similar reductions in affinity for GLP-1 and exendin 9-39. In contrast, other mutations either preferentially [K197 (TM2), Q234 (TM3), and W284 (extracellular loop 2)] or solely [D198 (TM2) and R310 (TM5)] reduced GLP-1 affinity. Reduced agonist affinity was always associated with reduced potency. However, reductions in potency exceeded reductions in agonist affinity for K197A, W284A, and R310A, while H363A was uncoupled from cAMP generation, highlighting critical roles of these residues in translating binding to activation. Data show important roles in ligand binding and receptor activation of conserved residues within the transmembrane domain of the GLP-1R. The receptor structural model provides insight into the roles of these residues.


Figures

Fig. 1.
Fig. 1.
Amino acid sequences of ligands of the GLP-1R. The aligned amino acid sequences of the GLP-1R agonists GLP-1 7–36 amide, GLP-1 7–37, and exendin-4 are shown alongside that of the antagonist exendin 9–39. The residues highlighted in bold are conserved between GLP-1 and exendin.
Fig. 2.
Fig. 2.
Schematic representation of the transmembrane domain and connecting loops of the hGLP-1R. The linear sequence was obtained from the NCBI database (rs1042044; var105098 as used in the present study). Residues mutated in the present study are shown by white text in black circles. All of these residues are fully conserved across the cloned mammalian GLP-1Rs (chimpanzee, dog, human, mouse, rat, rhesus monkey, sheep) with the exceptions of K197, which has a conservative substitution of arginine in the dog sequence and Y152 which is replaced by serine in the rhesus monkey sequence. Dashed lines indicate missing residues. This representation is based on our final model of the GLP-1R and differs slightly from the transmembrane helices identified in the Swiss-Prot entry (P43220). Note that although W284 was selected for mutation based on its location in TM4, as suggested in Swiss-Prot, our model suggests that this residue is at the proximal end of EC2, immediately adjacent to TM4. Figure was based on one generated using the residue-based diagram editor RbDe (55).
Fig. 3.
Fig. 3.
Binding of exendin 9–39 and GLP-1 7–36 amide to the WT hGLP-1R. Homologous and heterologous competition binding assays were carried out on membranes prepared from HEK-293 cells transiently transfected with the WT hGLP-1R using [125I]exendin 9–39. A homologous binding curve was fitted to the exendin 9–39 data and a sigmoidal curve to the GLP-1 7–36 amide data. Data show total binding and are expressed as mean ± sem, n = 5.
Fig. 4.
Fig. 4.
Ligand binding and cAMP generation by mutated hGLP-1Rs. A and B, Homologous and heterologous competition binding assays were carried out on membranes prepared from HEK-293 cells transiently transfected with the WT and mutated GLP-1Rs using [125I]exendin 9–39. Homologous binding curves were fitted to the exendin 9–39 data and a sigmoidal curve was fitted to the GLP-1 7–36 amide data. Data are expressed as mean ± sem with n = 5 for the WT receptor and n = 3 for each of the mutated receptors. C, Transiently transfected cells were stimulated, in the presence of 1 mm IBMX, for 1 h with varying concentrations of either GLP-1 7–37 or FSK (50 μm) at 37 C. The cAMP was extracted and measured and expressed as a proportion of the response to FSK. Sigmoidal concentration-response curves were fitted. Curves represent the means of n = 7 for the WT receptor and n = 3 for the mutated receptors (error bars omitted for clarity). In each of the panels, data from the WT hGLP-1R and the Y152A (TM1), D198A (TM2), W284A (EC2), R310A (TM5), and H363A (TM6) mutations have been shown to demonstrate the range of alterations observed. The binding affinities for GLP-1 7–36 amide and exendin 9–39 (KI and Kd values, respectively) and receptor expression levels derived from experiments on all receptor constructs are given in Table 2. Similarly, potency estimates and Emax values for cAMP generation derived from experiments on all receptor constructs are given in Table 3.
Fig. 5.
Fig. 5.
The three-dimensional (3D) model of the GLP-1R and example close-up images to highlight specific structural features and interactions. A, The 3D model showing the hGLP-1R with GLP-1 bound. GLP-1 is shown as black spheres (backbone atoms only). In all images the transmembrane helices are rainbow colored: TM1, red; TM2, orange; TM3, yellow; TM4 green; TM5, blue; TM6, indigo; TM7, violet. The N-terminal domain is gray-blue. Intracellular and extracellular loops are gray, and the ligand (GLP-1) is black. Within those amino acid residues in which some structure is shown, the colors of the helices are used to indicate carbon atoms whereas nitrogen is blue, oxygen is red, and sulfur is yellow. Nonbonded interactions are shown as dotted orange lines. B, The region surrounding Y152 (TM1) showing that this residue exists in a hydrophobic pocket interacting with some aromatic residues, providing a structured region. Mutation to alanine (Y152A) would be expected to allow conformational collapse, possibly affecting the surrounding structures including EC1. C, The region surrounding D198 (TM2) showing the interaction of this residue with H7 at the N terminus of GLP-1 (L:H7). G295 (TM3) is also predicted to interact with L:H7, and K202 is predicted to interact with L:E9. D, The region surrounding W284 (EC2) is shown to illustrate its role as a space-filling residue displaying an aromatic stacking interaction with Y289 (EC2) and F230 (TM3) that provides conformational support, particularly to EC2. E, The region surrounding R310 (TM5) showing a strong salt bridge with E364 (TM6). F, The region surrounding H363 (TM6) showing its position in an aromatic pocket formed by F390 and F393.
Fig. 6.
Fig. 6.
Helical wheel model of the transmembrane domain of the hGLP-1R. Only the upper half of the transmembrane domain is shown with the helices labeled I–VII. The N terminus of GLP-1 is also shown inserted between the transmembrane domain. The diagram represents the hydrophilic residues as circles, hydrophobic residues as diamonds, potentially negatively charged residues as triangles, and potentially positively charged residues as pentagons. Hydrophobicity is color coded: the most hydrophobic residues are green with the intensity of the green decreasing in relation to the loss of hydrophobicity. Zero hydrophobicity is coded as yellow. Hydrophilic residues are coded red with pure red being the most hydrophilic (uncharged) residue and the intensity of red decreasing through orange with loss of hydrophilicity. Residues that are potentially charged are light purple. The interaction of D198 (TM2) with residue H7 of GLP-1 (L:H7) and the interaction of K202 (TM2) with L:E9 are shown. Residues mutated in the current study are circled in red.

References

    1. Orskov C , Rabenhøj L , Wettergren A , Kofod H , Holst JJ. 1994. Tissue and plasma concentrations of amidated and glycine- extended glucagon-like peptide I in humans. Diabetes 43:535–539 - PubMed
    1. Bavec A , Hällbrink M , Langel U , Zorko M. 2003. Different role of intracellular loops of glucagon-like peptide-1 receptor in G-protein coupling. Regul Pept 111:137–144 - PubMed
    1. Hällbrink M , Holmqvist T , Olsson M , Ostenson CG , Efendic S , Langel U. 2001. Different domains in the third intracellular loop of the GLP-1 receptor are responsible for Gαs and Gαi/Gαo activation. Biochim Biophys Acta 1546:79–86 - PubMed
    1. Montrose-Rafizadeh C , Avdonin P , Garant MJ , Rodgers BD , Kole S , Yang H , Levine MA , Schwindinger W , Bernier M. 1999. Pancreatic glucagon-like peptide-1 receptor couples to multiple G proteins and activates mitogen-activated protein kinase pathways in Chinese hamster ovary cells. Endocrinology 140:1132–1140 - PubMed
    1. Baggio LL , Drucker DJ. 2007. Biology of incretins: GLP-1 and GIP. Gastroenterology 132:2131–2157 - PubMed

Publication types

MeSH terms