

Development of prognosis in palliative care study (PiPS) predictor models to improve prognostication in advanced cancer: prospective cohort study
- PMID: 21868477
- PMCID: PMC3162041
- DOI: 10.1136/bmj.d4920
Development of prognosis in palliative care study (PiPS) predictor models to improve prognostication in advanced cancer: prospective cohort study
Abstract
Objective: To develop a novel prognostic indicator for use in patients with advanced cancer that is significantly better than clinicians' estimates of survival.
Design: Prospective multicentre observational cohort study.
Setting: 18 palliative care services in the UK (including hospices, hospital support teams, and community teams).
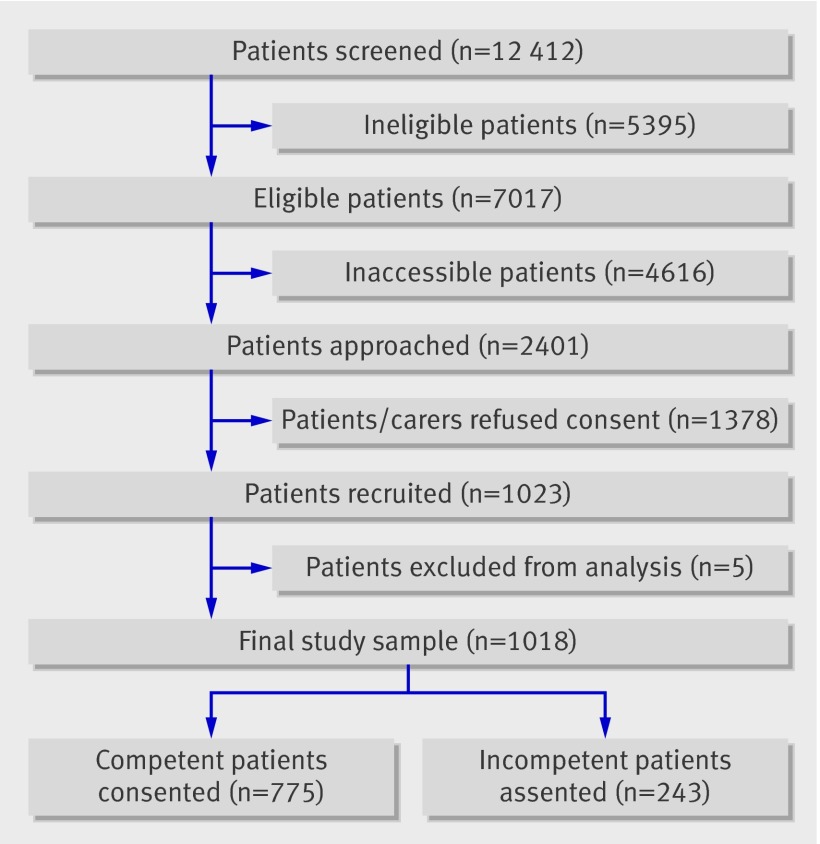
Participants: 1018 patients with locally advanced or metastatic cancer, no longer being treated for cancer, and recently referred to palliative care services.
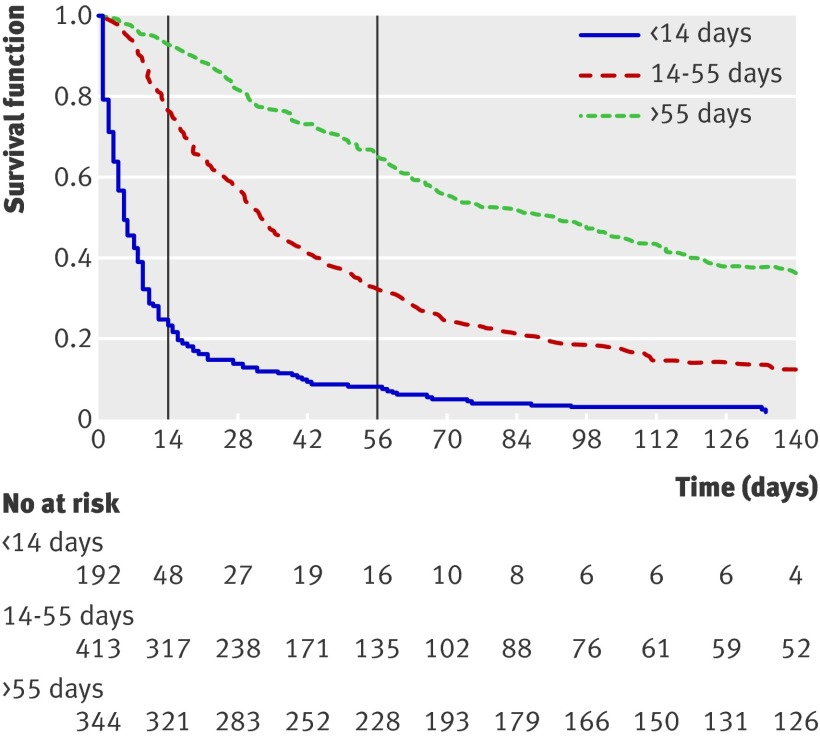
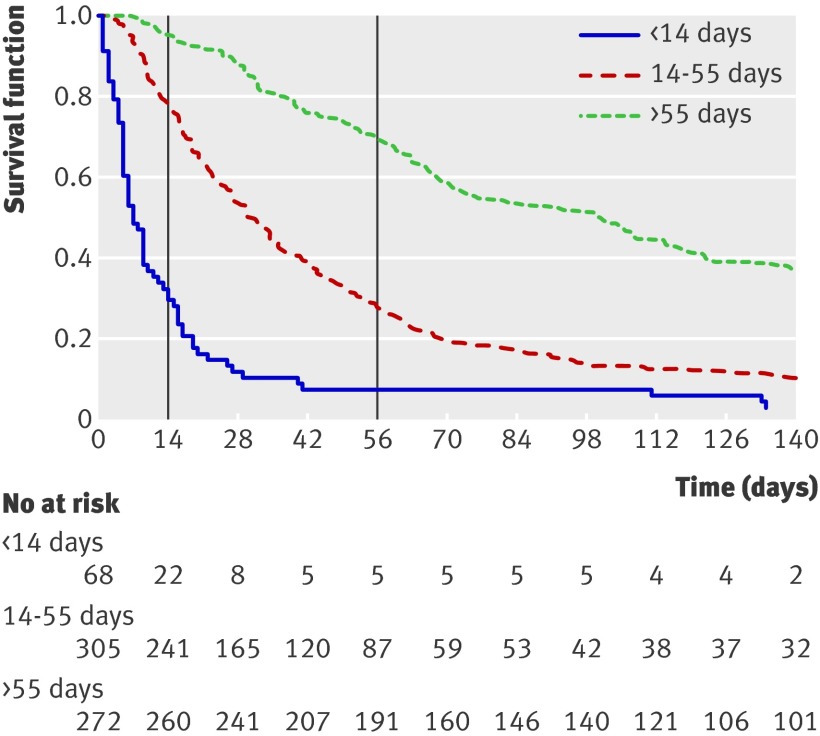
Main outcome measures: Performance of a composite model to predict whether patients were likely to survive for "days" (0-13 days), "weeks" (14-55 days), or "months+" (>55 days), compared with actual survival and clinicians' predictions.
Results: On multivariate analysis, 11 core variables (pulse rate, general health status, mental test score, performance status, presence of anorexia, presence of any site of metastatic disease, presence of liver metastases, C reactive protein, white blood count, platelet count, and urea) independently predicted both two week and two month survival. Four variables had prognostic significance only for two week survival (dyspnoea, dysphagia, bone metastases, and alanine transaminase), and eight variables had prognostic significance only for two month survival (primary breast cancer, male genital cancer, tiredness, loss of weight, lymphocyte count, neutrophil count, alkaline phosphatase, and albumin). Separate prognostic models were created for patients without (PiPS-A) or with (PiPS-B) blood results. The area under the curve for all models varied between 0.79 and 0.86. Absolute agreement between actual survival and PiPS predictions was 57.3% (after correction for over-optimism). The median survival across the PiPS-A categories was 5, 33, and 92 days and survival across PiPS-B categories was 7, 32, and 100.5 days. All models performed as well as, or better than, clinicians' estimates of survival.
Conclusions: In patients with advanced cancer no longer being treated, a combination of clinical and laboratory variables can reliably predict two week and two month survival.
Conflict of interest statement
Competing interests: All authors have completed the Unified Competing Interest form at
Figures
Republished in
-
Development of Prognosis in Palliative care Study (PiPS) predictor models to improve prognostication in advanced cancer: prospective cohort study.BMJ Support Palliat Care. 2012 Mar;2(1):63-71. doi: 10.1136/bmjspcare.2012.d4920rep. BMJ Support Palliat Care. 2012. PMID: 24653502
-
Development of Prognosis in Palliative care Study (PiPS) predictor models to improve prognostication in advanced cancer: prospective cohort study.BMJ Support Palliat Care. 2015 Dec;5(4):390-8. doi: 10.1136/bmjspcare-2012-d4020rep. BMJ Support Palliat Care. 2015. PMID: 26586684
Comment in
-
Predicting and communicating prognosis in palliative care.BMJ. 2011 Aug 25;343:d5171. doi: 10.1136/bmj.d5171. BMJ. 2011. PMID: 21868479 No abstract available.
-
Modelling study of prognostic indicators for patients with locally advanced or metastatic cancer identifies variables that predict short-term survival in palliative care.Evid Based Med. 2012 Apr;17(2):62-3. doi: 10.1136/ebmed.2011.100303. Epub 2011 Dec 7. Evid Based Med. 2012. PMID: 22160149 No abstract available.
References
-
- Adams E, Boulton M, Watson E. The information needs of partners and family members of cancer patients: a systematic literature review. Patient Educ Couns 2009;77:179-86. - PubMed
-
- Degner LF, Kristjanson LJ, Bowman D, Sloan JA, Carriere KC, O’Neill J, et al. Information needs and decisional preferences in women with breast cancer. JAMA 1997;277:1485-92. - PubMed
-
- Steinhauser KE, Christakis NA, Clipp EC, McNeilly M, Grambow S, Parker J, et al. Preparing for the end of life: preferences of patients, families, physicians, and other care providers. J Pain Symptom Manage 2001;22:727-37. - PubMed
-
- Kutner JS, Steiner JF, Corbett KK, Jahnigen DW, Barton PL. Information needs in terminal illness. Soc Sci Med 1999;48:1341-52. - PubMed
Publication types
MeSH terms
Grants and funding
LinkOut - more resources
Full Text Sources
Medical
Research Materials