. 2012 Jan;190(1):159-74.
doi: 10.1534/genetics.111.131136. Epub 2011 Aug 25.

Combining markers into haplotypes can improve population structure inference

Affiliations

Combining markers into haplotypes can improve population structure inference

Lucie M Gattepaille et al. Genetics. 2012 Jan.

Abstract

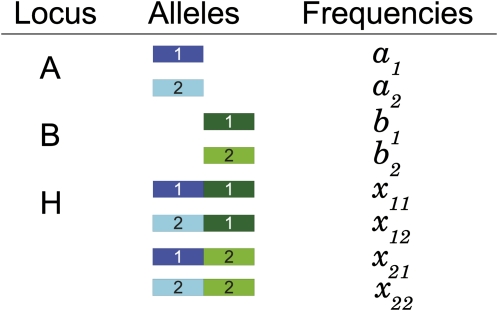
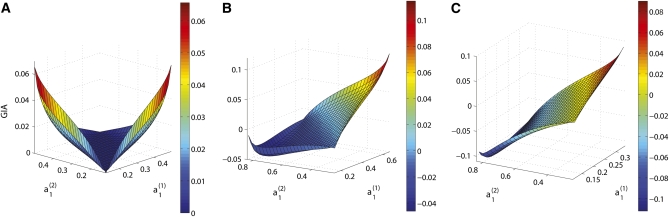
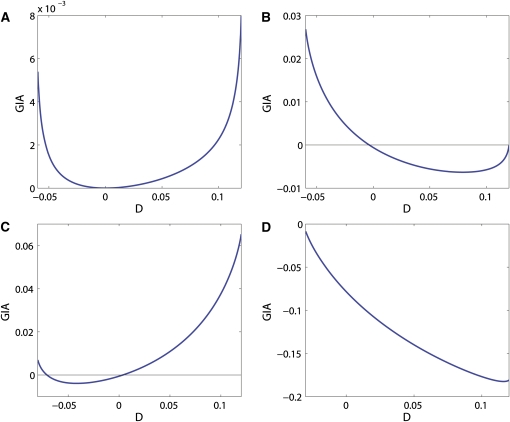
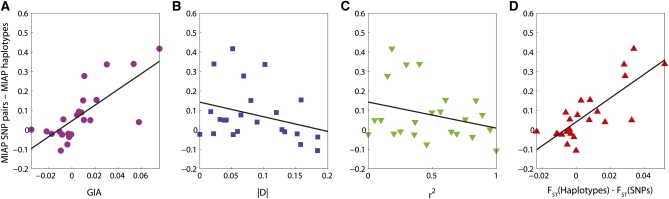
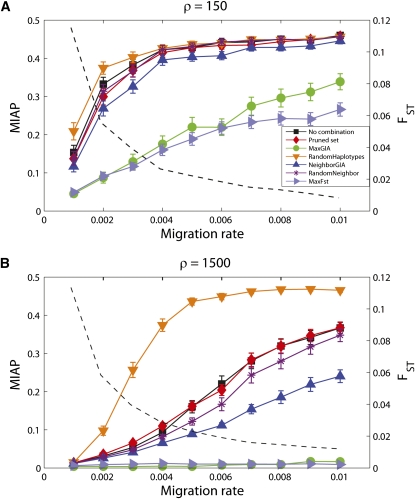
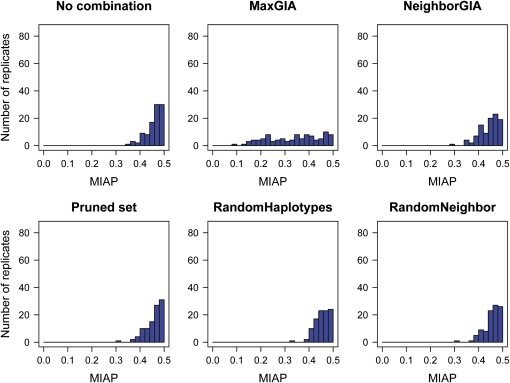
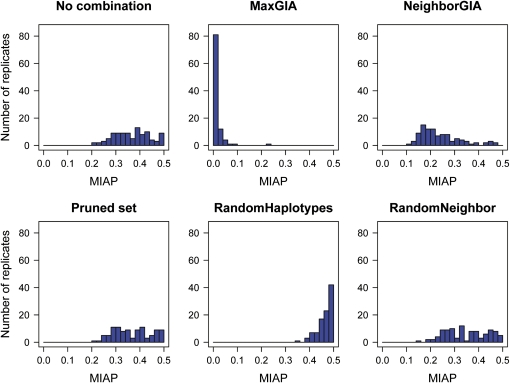
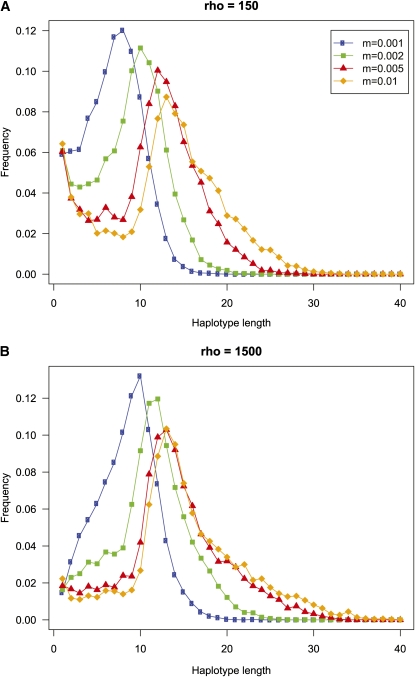
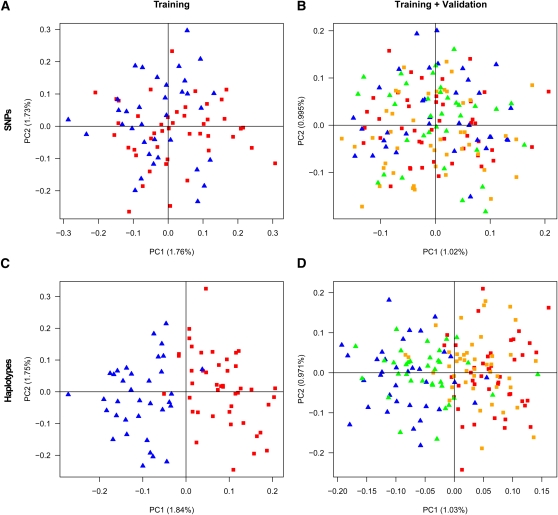
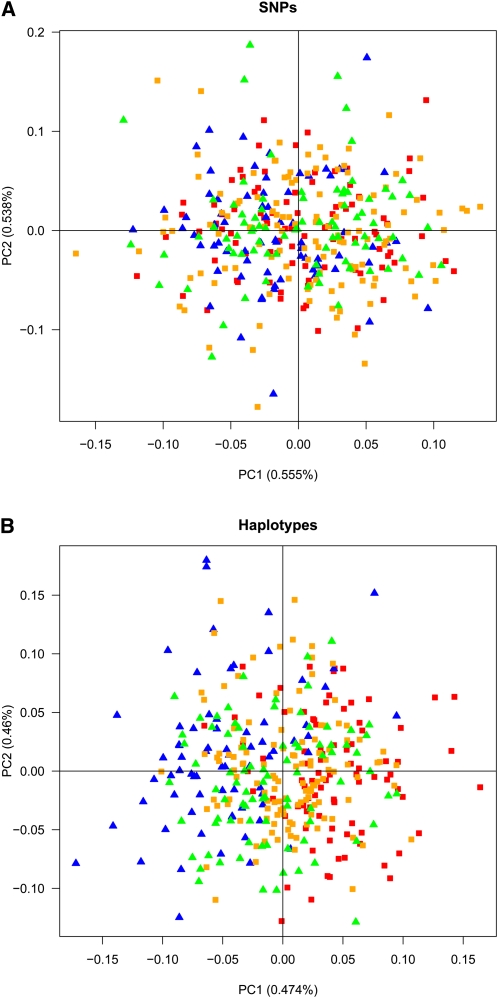
High-throughput genotyping and sequencing technologies can generate dense sets of genetic markers for large numbers of individuals. For most species, these data will contain many markers in linkage disequilibrium (LD). To utilize such data for population structure inference, we investigate the use of haplotypes constructed by combining the alleles at single-nucleotide polymorphisms (SNPs). We introduce a statistic derived from information theory, the gain of informativeness for assignment (GIA), which quantifies the additional information for assigning individuals to populations using haplotype data compared to using individual loci separately. Using a two-loci-two-allele model, we demonstrate that combining markers in linkage equilibrium into haplotypes always leads to nonpositive GIA, suggesting that combining the two markers is not advantageous for ancestry inference. However, for loci in LD, GIA is often positive, suggesting that assignment can be improved by combining markers into haplotypes. Using GIA as a criterion for combining markers into haplotypes, we demonstrate for simulated data a significant improvement of assigning individuals to candidate populations. For the many cases that we investigate, incorrect assignment was reduced between 26% and 97% using haplotype data. For empirical data from French and German individuals, the incorrectly assigned individuals can, for example, be decreased by 73% using haplotypes. Our results can be useful for challenging population structure and assignment problems, in particular for studies where large-scale population-genomic data are available.


Figures

Figure 1
Figure 1
Notation for frequencies of the two alleles at locus A, the two alleles at locus B, and the four alleles at haplotype locus H formed by combining the alleles at locus A and locus B.
Figure 2
Figure 2
GIA as a function of a1(1), a1(2), when D = 0.1, for different fixed values of b1(1) and b1(2). (A) b1(1)=0.2 and b1(2)=0.2; (B) b1(1)=0.3 and b1(2)=0.6; (C) b1(1)=0.15 and b1(2)=0.6.
Figure 3
Figure 3
GIA as a function of D for fixed values of the allele frequencies in both populations. (A) a1(1)=0.4, a1(2)=0.3, and b1(1)=b1(2)=0.2; (B) a1(1)=0.2, a1(2)=0.3, b1(1)=0.3, and b1(2)=0.6; (C) a1(1)=0.4, a1(2)=0.3, b1(1)=0.2, and b1(2)=0.5; (D) a1(1)=0.15, a1(2)=0.8, b1(1)=0.2, and b1(2)=0.8.
Figure 4
Figure 4
The difference in assignment accuracy (MIAP) based on SNPs and haplotypes as a function of GIA, LD (|D| and r2), and the difference between FST for haplotype loci and FST for SNPs (values are given in Table 2). A linear regression line is included for each comparison. (A) GIA, ρ = 0.748, y = 4.1x + 0.046 (P = 4 × 10⁻⁵); (B) |D|, ρ = −0.302, y = −0.75x + 0.14 (P = 0.16); (C) r2, ρ = −0.289, y = −0.13x + 0.14 (P = 0.18); (D) FST(Haplotypes) − FST(SNPs), ρ = 0.790, y = 6.1x + 0.040 (P = 7 × 10⁻⁶).
Figure 5
Figure 5
Mean incorrect assignment proportion (MIAP) computed on the basis of assignment of 200 individuals using STRUCTURE for different strategies of combining SNPs and for different migration rates. A total of 1000 SNPs for a fragment of DNA are simulated for 200 haploid individuals, 100 from each of two populations, and with a scaled recombination rate (ρ) of 150 (A) or 1500 (B) for the entire DNA fragment. MIAP values are averages across 100 replicate simulations and error bars give the interval ±1.96 times the standard error of the mean. Mean FST (based on SNPs) is included for comparison and shown as a dashed line.
Figure 6
Figure 6
Histograms of the mean incorrect assignment probabilities (MIAP) for 100 replicates of simulated data from a two-island-model with migration rate m = 0.01 and a scaled recombination rate of ρ = 150. The simulated SNP data are combined according to six different strategies, no combination, pruned set, MaxGIA, RandomHaplotypes, NeighborGIA, and RandomNeighbor, and MIAP is computed for each strategy on the basis of assignment of individuals using STRUCTURE.
Figure 7
Figure 7
Histograms of the mean incorrect assignment probabilities (MIAP) for 100 replicates of simulated data from a two-island model with migration rate m = 0.01 and a scaled recombination rate of ρ = 1500. The simulated SNP data are combined according to six different strategies, no combination, pruned set, MaxGIA, RandomHaplotypes, NeighborGIA, and RandomNeighbor, and MIAP is computed for each strategy on the basis of assignment of individuals using STRUCTURE.
Figure 8
Figure 8
Distribution of the length in number of SNPs of the haplotype loci constructed with the MaxGIA strategy, computed for 100 replicate simulations and for four different migration rates. Results for two different recombination rates are presented: (A) a high-recombination case (ρ = 150) and (B) a low-recombination case (ρ = 1500).
Figure 9
Figure 9
Principal component analysis (PCA) for the individuals in the training set (A and C) and for both the training and the validation individuals (B and D), based on 105,341 SNPs (A and B), and based on the 54,762 haplotype loci constructed from the training set (C and D). Each plot shows the two first PCs. French individuals are represented by squares, red for training, orange for validation. German individuals are represented by triangles, blue for training and green for validation.
Figure 10
Figure 10
Principal component analysis for 125 Swiss–French individuals (orange squares), 84 Swiss–German individuals (green triangles), 89 French individuals (red squares), and 70 German individuals (blue triangles). (A) Individuals plotted in the two first PCs based on 105,341 SNPs. (B) Individuals plotted in the two first PCs based on 50,268 haplotype loci constructed from a training set of the French and the German individuals.

References

    1. Adams J. R., Lucash C., Schutte L., Waits L. P., 2007. Locating hybrid individuals in the red wolf (Canis rufus) experimental population area using a spatially targeted sampling strategy and faecal DNA genotyping. Mol. Ecol. 16: 1823–1834 - PubMed
    1. Aitken C. G. G., Taroni F., 2004. Statistics and the Evaluation of Evidence for Forensic Scientists, Ed. 2 John Wiley & Sons, New York
    1. Alexander D. H., Novembre J., Lange K., 2009. Fast model-based estimation of ancestry in unrelated individuals. Genome Res. 19: 1655–1664 - PMC - PubMed
    1. Anderson E. C., Thompson E. A., 2002. A model-based method for identifying species hybrids using multilocus genetic data. Genetics 160: 1217–1229 - PMC - PubMed
    1. Balding D. J., Nichols R. A., 1994. DNA profile match probability calculation: how to allow for population stratification, relatedness, database selection and single bands. Forensic Sci. Int. 64: 125–140 - PubMed

Publication types

Substances