. 2011 Nov;189(3):939-49.
doi: 10.1534/genetics.111.130468. Epub 2011 Aug 25.

Cost of adaptation and fitness effects of beneficial mutations in Pseudomonas fluorescens

Affiliations

Cost of adaptation and fitness effects of beneficial mutations in Pseudomonas fluorescens

Thomas Bataillon et al. Genetics. 2011 Nov.

Abstract

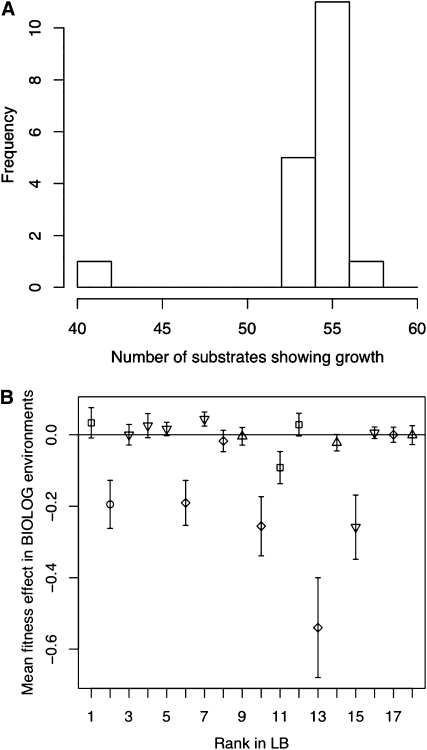
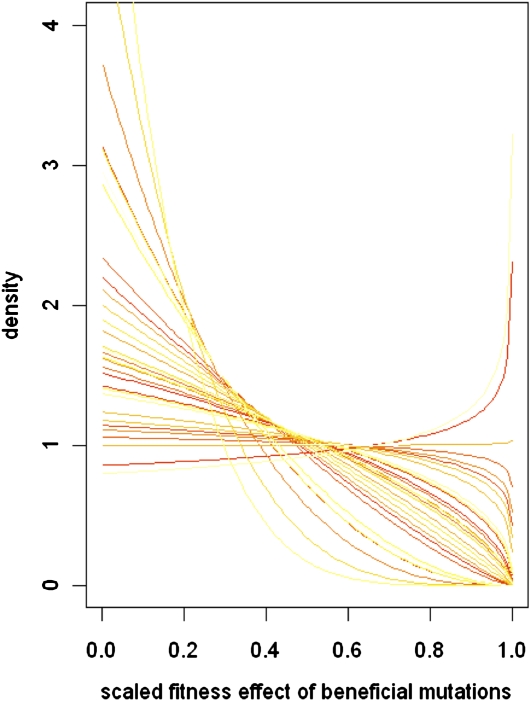
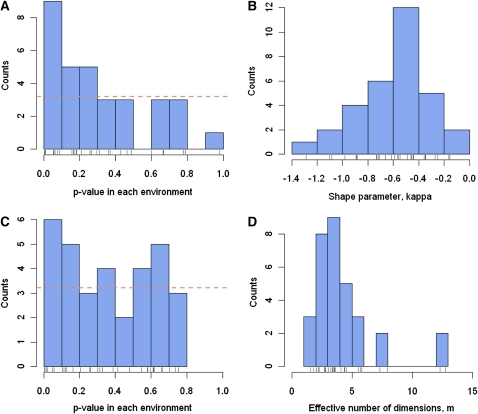
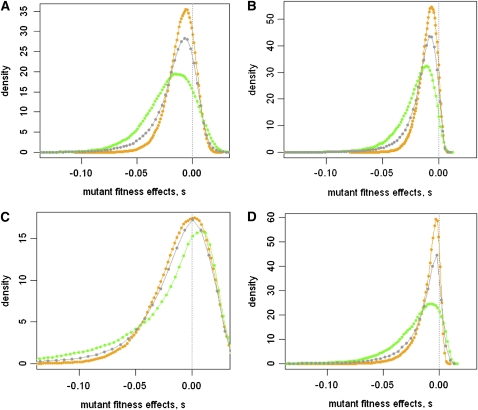
Adaptations are constructed through the sequential substitution of beneficial mutations by natural selection. However, the rarity of beneficial mutations has precluded efforts to describe even their most basic properties. Do beneficial mutations typically confer small or large fitness gains? Are their fitness effects environment specific, or are they broadly beneficial across a range of environments? To answer these questions, we used two subsets (n = 18 and n = 63) of a large library of mutants carrying antibiotic resistance mutations in the bacterium Pseudomonas fluorescens whose fitness, along with the antibiotic sensitive ancestor, was assayed across 95 novel environments differing in the carbon source available for growth. We explore patterns of genotype-by-environment (G × E) interactions and ecological specialization among the 18 mutants initially found superior to the sensitive ancestor in one environment. We find that G × E is remarkably similar between the two sets of mutants and that beneficial mutants are not typically associated with large costs of adaptation. Fitness effects among beneficial mutants depart from a strict exponential distribution: they assume a variety of shapes that are often roughly L shaped but always right truncated. Distributions of (beneficial) fitness effects predicted by a landscape model assuming multiple traits underlying fitness and a single optimum often provide a good description of the empirical distributions in our data. Simulations of data sets containing a mixture of single and double mutants under this landscape show that inferences about the distribution of fitness effects of beneficial mutants is quite robust to contamination by second-site mutations.


Figures

Figure 1
Figure 1
Patterns of ecological specialization of the 18 beneficial mutations. (A) Distribution of number of environments showing growth in the top 18 mutants. Note that the niche breadth of the ancestral type is at the mode of the distribution (i.e., could grow in 55 environments). (B) Mean fitness effects (averaged across all carbon sources) of the top 18 mutants. Rank is based on the performance in the initial environment (LB). Symbols designate known (to date) mutations in the 500-bp region of the gyrA QRDR: □, Asp87Gly; ○, Asp87Ala; ▿, WT; ⋄, Asp87Tyr; ▵, Thr83Ile.
Figure 2
Figure 2
Distribution of fitness effects among pure vs. contaminated mutant genotypes. All distributions are based on the simulation of 100,000 independent mutant genotypes under the assumption of FGM parameterized as described in Materials and Methods. Note that for graphical convenience we do not display these empirical distributions as histograms but report here smoothed distributions. Orange: DFE of pure single-step mutant genotypes (ideal conditions) Gray: DFE of mutant genotypes carrying one mutation affecting fitness plus a Poisson-distributed number of extra mutations (rate of contamination, λ = 0.5). This generates a mixture of pure single-step mutants contaminated with genotypes carrying extra mutations affecting fitness. (A) m = 5; E(s) = 0.01; so = 0.05. (B) m = 5; E(s) = 0.01; so = 0.01. (C) m = 2; E(s) = 0.01; so = 0.05; Poisson rate of contamination, λ = 0.5. (D) m = 2; E(s) = 0.01; so = 0.01; Poisson rate of contamination, λ = 0.5.
Figure 3
Figure 3
Meta-analysis of the DFE across environments. (A) Distribution of P-values associated with the test of the departure from an exponential DFE in each environment. The horizontal line denotes the expected counts of P-values in each bin on the basis of the global null hypothesis that DFE is exponential in every environment. (B) Distribution of the shape parameter, κ, of the DFE of beneficial mutations in each environment. κ was estimated in each environment using an estimator proposed by Rokyta et al. (2008) that is more accurate than maximum-likelihood estimates when the shape parameter is negative. (C) Distribution of P-values associated with LRT for the departure from the null hypothesis of a constrained β-distribution for DFE in each environment. The horizontal line denotes the expected counts of P-values in each bin based on the global null hypothesis that DFE is a constrained β, Be[1,b], in every environment. (D) Distribution of the effective number of independent phenotypic traits, m, describing Fisher’s geometric landscape in each environment. Estimates of m are based on the theoretical relationship between m and the shape parameter (κ) of the DFE of beneficial mutations (κ).
Figure 4
Figure 4
Comparison of the effect of environmental contrast on the amount of variance due to G×E, VGE, in both data sets. The macroenvironmental contrast is calculated as the squared difference in mean performance in each environment (averaged across the set of strains).
Figure 5
Figure 5
Diversity of shapes for the scaled DFE of beneficial mutations. Each curve represents the constrained β-distribution best fitting the scaled empirical DFE of beneficial mutants in each environment (n = 32). All DFE predicted under the FGM model have a right tail that is truncated but, depending on the underlying number of dimensions, m, the distributions assume a variety of shapes. Distributions with m > 2 are essentially L shaped. When m = 2, distributions are flat (uniform). DFE can even be J shaped (when m < 2).

References

    1. Bagel S., Hullen V., Wiedemann B., Heisig P., 1999. Impact of gyrA and parC mutations on quinolone resistance, doubling time, and supercoiling degree of Escherichia coli. Antimicrob. Agents Chemother. 43: 868–875 - PMC - PubMed
    1. Beisel C. J., Rokyta D. R., Wichman H. A., Joyce P., 2007. Testing the extreme value domain of attraction for distributions of beneficial fitness effects. Genetics 176: 2441–2449 - PMC - PubMed
    1. Bell G., 1997. Selection: The Mechanism of Evolution. Chapman & Hall, London/New York
    1. Breidenstein E. B., Khaira B. K., Wiegand I., Overhage J., Hancock R. E., 2008. Complex ciprofloxacin resistome revealed by screening a Pseudomonas aeruginosa mutant library for altered susceptibility. Antimicrob. Agents Chemother. 52: 4486–4491 - PMC - PubMed
    1. Eyre-Walker A., Keightley P. D., 2007. The distribution of fitness effects of new mutations. Nat. Rev. Genet. 8: 610–618 - PubMed

Publication types

MeSH terms