Multicenter Study
. 2011 Oct;6(10):2452-61.
doi: 10.2215/CJN.00710111. Epub 2011 Aug 25.

C-reactive protein and prediction of 1-year mortality in prevalent hemodialysis patients

Affiliations
Multicenter Study

C-reactive protein and prediction of 1-year mortality in prevalent hemodialysis patients

Jonathan Bazeley et al. Clin J Am Soc Nephrol. 2011 Oct.

Abstract

Background and objectives: Measurement of C-reactive protein (CRP) levels remains uncommon in North America, although it is now routine in many countries. Using Dialysis Outcomes and Practice Patterns Study data, our primary aim was to evaluate the value of CRP for predicting mortality when measured along with other common inflammatory biomarkers.

Design, setting, participants, & measurements: We studied 5061 prevalent hemodialysis patients from 2005 to 2008 in 140 facilities routinely measuring CRP in 10 countries. The association of CRP with mortality was evaluated using Cox regression. Prediction of 1-year mortality was assessed in logistic regression models with differing adjustment variables.

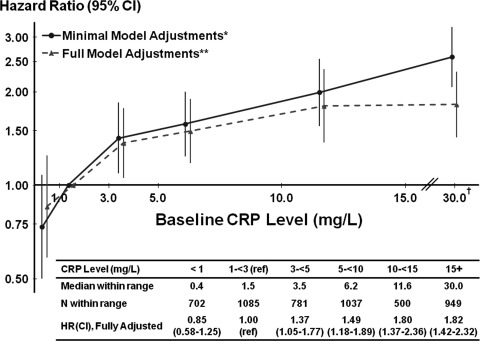
Results: Median baseline CRP was lower in Japan (1.0 mg/L) than other countries (6.0 mg/L). CRP was positively, monotonically associated with mortality. No threshold below which mortality rate leveled off was identified. In prediction models, CRP performance was comparable with albumin and exceeded ferritin and white blood cell (WBC) count based on measures of model discrimination (c-statistics, net reclassification improvement [NRI]) and global model fit (generalized R(2)). The primary analysis included age, gender, diabetes, catheter use, and the four inflammatory markers (omitting one at a time). Specifying NRI ≥5% as appropriate reclassification of predicted mortality risk, NRI for CRP was 12.8% compared with 10.3% for albumin, 0.8% for ferritin, and <0.1% for WBC.

Conclusions: These findings demonstrate the value of measuring CRP in addition to standard inflammatory biomarkers to improve mortality prediction in hemodialysis patients. Future studies are indicated to identify interventions that lower CRP and to identify whether they improve clinical outcomes.


Figures

Figure 1.
Figure 1.
Percent of facilities by country that routinely measured C-reactive protein (CRP) (2005 to 2006), routinely defined as at least quarterly on ≥75% of patients. Other than Canada and US, 67% of facilities measured CRP routinely. SWE, Sweden; FRA, France; BEL, Belgium; JPN, Japan; GER, Germany; SPA, Spain; ITA, Italy; UK, United Kingdom; ANZ, Australia-New Zealand; CAN, Canada; US, United States.
Figure 2.
Figure 2.
Distribution of C-reactive protein (CRP) by country, restricted to patients on dialysis >90 days in facilities that routinely measure CRP (n = 4586). The top and bottom of the boxes indicate the 25th and 75th percentiles of the distribution. The horizontal line within the box indicates the median (50th percentile), and the diamond indicates the mean. Vertical lines extend to the 5th and 95th percentiles. The line extending to the 95th percentile was truncated at 30 mg/L. Outside of Japan, the 95th percentile ranged from 37 mg/L in Italy to 75 mg/L in Australia-New Zealand. JPN, Japan; GER, Germany; ITA, Italy; SPA, Spain; FRA, France; BEL, Belgium; UK, United Kingdom; SWE, Sweden; ANZ, Australia-New Zealand.
Figure 3.
Figure 3.
Hazard ratio (HR) for mortality by baseline C-reactive protein (CRP) among 5054 patients (1105 deaths) from 10 countries with vintage (total time on dialysis) >90 days. *Adjusted for age, gender, ln (vintage), stratified by country, and accounting for facility clustering. **Additionally adjusted for body mass index, smoking, residual kidney function, 13 summary comorbid conditions, baseline laboratory values (albumin, calcium, creatinine, ferritin, hemoglobin, phosphate, BUN, total cholesterol, uric acid, and WBC), and catheter use. HRs are plotted at the median of each category. 30.0 = Median of the 15+ mg/dl category. CI, confidence interval; BUN, blood urea nitrogen; WBC, white blood cell.
Figure 4.
Figure 4.
Hazard ratio for cause-specific mortality by baseline C-reactive protein (CRP) among 5054 patients (939 deaths) with vintage >90 days and recorded cause of death. Deaths with missing cause of death (n = 166) were treated as censoring events. Stratified by country and accounting for facility clustering. Adjusted for age, gender, ln (vintage), body mass index, smoking, residual kidney function, 13 summary comorbid conditions, baseline laboratory values (albumin, calcium, creatinine, ferritin, hemoglobin, phosphate, BUN, total cholesterol, uric acid, and WBC), and catheter use. HRs for each cause of death calculated in separate models with alternative causes of death as censoring events. HRs are plotted at the median of each category. Median of the 15+ mg/dl category. BUN, blood urea nitrogen; WBC, white blood cell.
Figure 5.
Figure 5.
Predicted 1-year risk of mortality from models with and without (A) C-reactive protein (CRP), (B) albumin, (C) ferritin, and (D) White blood cells (WBC) count. Models are adjusted for indicated variables, the other three inflammatory markers, and age, gender, diabetes, and catheter use. Dotted lines indicate ± 5% from the line of unity (The line of unity indicating no additional predictive risk value associated with addition of the variable to the model). The Net Reclassification Improvement (NRI) summarizes the number of patients who were correctly moved across the 5% threshold after the addition of each inflammatory marker (up for patients who died; down for patients who survived), minus those who were reclassified incorrectly (down for patients who died; up for patients who survived). Graphs are truncated at 30% predicted risk.

References

    1. U.S. Renal Data System: USRDS 2010 Annual Data Report: Atlas of Chronic Kidney Disease and End-Stage Renal Disease in the United States. National Institutes of Health, National Institute of Diabetes and Digestive and Kidney Diseases, Bethesda, MD, 2010
    1. Owen WF, Lowrie EG: C-reactive protein as an outcome predictor for maintenance hemodialysis patients. Kidney Int 54: 627–636, 1998 - PubMed
    1. Yeun JY, Levine RA, Mantadilok V, Kaysen GA: C-reactive protein predicts all-cause and cardiovascular mortality in hemodialysis patients. Am J Kidney Dis 35: 469–476, 2000 - PubMed
    1. Zimmermann J, Herrlinger S, Pruy A, Metzger T, Wanner C: Inflammation enhances cardiovascular risk and mortality in hemodialysis patients. Kidney Int 55: 648–658, 1999 - PubMed
    1. deFilippi C, Wasserman S, Rosanio S, Tiblier E, Sperger H, Tocchi M, Christenson R, Uretsky B, Smiley M, Gold J, Muniz H, Badalamenti J, Herzog C, Henrich W: Cardiac troponin T and C-reactive protein for predicting prognosis, coronary atherosclerosis, and cardiomyopathy in patients undergoing long-term hemodialysis. J Am Med Assoc 290: 353–359, 2003 - PubMed

Publication types

MeSH terms