. 2011 Oct 7;334(6052):89-94.
doi: 10.1126/science.1209202. Epub 2011 Aug 25.

The shaping of modern human immune systems by multiregional admixture with archaic humans

Affiliations

The shaping of modern human immune systems by multiregional admixture with archaic humans

Laurent Abi-Rached et al. Science. .

Abstract

Whole genome comparisons identified introgression from archaic to modern humans. Our analysis of highly polymorphic human leukocyte antigen (HLA) class I, vital immune system components subject to strong balancing selection, shows how modern humans acquired the HLA-B*73 allele in west Asia through admixture with archaic humans called Denisovans, a likely sister group to the Neandertals. Virtual genotyping of Denisovan and Neandertal genomes identified archaic HLA haplotypes carrying functionally distinctive alleles that have introgressed into modern Eurasian and Oceanian populations. These alleles, of which several encode unique or strong ligands for natural killer cell receptors, now represent more than half the HLA alleles of modern Eurasians and also appear to have been later introduced into Africans. Thus, adaptive introgression of archaic alleles has significantly shaped modern human immune systems.


Figures
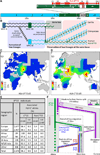
Fig.1
Fig.1
Modern humans acquired HLA-B*73 from archaic humans. (A) The B*73 haplotype contains segments most closely related to chimpanzee and gorilla MHC-B alleles (green) and flanking segments highly related to other HLA-B (blue) (brown segment is related to HLA-C) (fig. S4). (B) B*73 ’s divergent core has its roots in a gene duplication that occurred >16 million years ago (MYA). (left to right) MHC-B duplicated and diverged to form the MHC-BI and BII loci. One allele of BII recombined to the BI locus giving rise to the ancestor of B*73 and its gorilla and chimpanzee equivalents. B*73 is thus the only remnant in modern humans of a deeply divergent allelic lineage. §, mean and 95% credibility interval. (C–E) B*73:01 is predominantly found outside Africa (C) as is C*15:05 (D), which is strongly associated with B*73 in 3,676 individuals worldwide (E). Individuals with the B*73 haplotype were categorized on the basis of their geographic origin, and status of the most-commonly linked (C*15) and second-most commonly linked (C*12:02) HLA-C alleles (fig. S24). # includes Hispanic-Americans, ## includes African-Americans. (C–D) Scale bars give allele frequency (af) categories (top number, highest tick mark). (F) Archaic admixture (model ‘a’) or African origin (model ‘b’) could explain the distribution and association of B*73 with C*15:05; simulations favor the former (α=0.01–0.001) (figs. S9–11) (11). The dotted box indicates the part of the models examined by simulation.
Fig.2
Fig.2
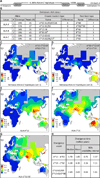
Effect of adaptive introgression of Denisovan HLA class I alleles on modern Asian and Oceanian populations. (A) Simplified map of the HLA class I region showing the positions of the HLA-A, -B and -C genes. (B) Five of the six Denisovan HLA-A, -B and -C alleles are identical to modern counterparts. Shown at the left for each allele is the number of sequence reads (4) specific to that allele and their coverage of the ~3.5kb HLA class I gene. Center columns give the modern-human allele (HLA type) that has the lowest number of SNP mismatches to the Denisovan allele. The next most similar modern allele and the number of SNP differences are shown in the columns on the right. ¶, a recombinant allele with 5’ segments originating from B*40. §, the coding sequence is identical to C*15:05:02. (C–D) Show the worldwide distributions of the two possible Denisovan HLA-A-C haplotype combinations. Both are present in modern Asians and Oceanians but absent from Sub-Saharan Africans. (E–G) The distribution of three Denisovan alleles: HLA-A*11 (E), C*15 (F), and C*12:02 (G), in modern human populations shows they are common in Asians but absent or rare in Sub-Saharan Africans. (H) Estimation of divergence times shows that A*11, C*15 and C*12:02 were formed before the Out-of-Africa migration. Shown on the left are the alleles they diverged from, on the right are the divergence time estimates: median, mean, and range.
Fig.3
Fig.3
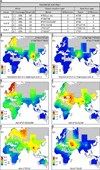
Effect of adaptive introgression of Neandertal HLA class I alleles on modern human populations. (A) All six Neandertal HLA-A, -B and -C alleles are identical to modern HLA class I alleles. Shown at the left for each allele is the number of allele-specific sequence reads (3) and their coverage of the ~3.5kb HLA gene. Center columns give the modern-human allele (HLA type) having the lowest number of SNP differences from the Neandertal allele. The next most similar modern allele and the number of SNP differences are shown in the columns on the right. §, includes additional rare alleles. (B–C) Show the worldwide distributions of the two possible Neandertal HLA-A-C haplotype combinations. Both are present in modern Eurasians, but absent from Sub-Saharan Africans. (D–G) Distribution of four Neandertal alleles: HLA-B*07:02/03/06 (D), B*51:01/08 (E), C*07:02 (F), and C*16:02 (G), in modern human populations.
Fig.4
Fig.4
Linkage disequilibrium (LD) decay patterns of modern HLA haplotypes identify putative archaic HLA alleles. (A) HLA class I recombination rates in Eurasia exceed those observed in Africa. We focused on the three intergenic regions between HLA-A, -B, and -C (leftmost column) in the four HapMap populations (center column) (20). Recombination rates were corrected for effective population size (11). (B) Enhanced HLA class I LD decay significantly correlates with archaic ancestry (α=0.0042; (11)). Shown for each HapMap population are (top row) the number of distinct HLA-A alleles present and (second row) the number exhibiting enhanced LD decay (all allele-defining SNPs (r2>0.2) are within 500kb of HLA-A (31)). The allele names are listed (rows 3–8) and colored green when observed in archaic humans (Figs 2–3) or associated with archaic-origin haplotypes (fig. S25). HLA-B and -C are shown in fig. S23. --- absent in the population. (C) Predicted archaic ancestry at HLA-A (on the basis of the six alleles of panel (B)) for the four HapMap populations and six populations from PNG; for the latter mean and extreme values are given. (E–F) Worldwide distribution in modern human populations of putative archaic HLA-A alleles (E) and KIR3DS1*013, a putative archaic NK cell receptor (F).

References

    1. Gibbons A. Science. 2011;331:392. - PubMed
    1. Yotova V, et al. Mol Biol Evol. 2011;28:1957. - PubMed
    1. Green RE, et al. Science. 2010;328:710. - PMC - PubMed
    1. Reich D, et al. Nature. 2010;468:1053. - PMC - PubMed
    1. Castric V, Bechsgaard J, Schierup MH, Vekemans X. PLoS Genet. 2008;4:e1000168. - PMC - PubMed

Publication types

MeSH terms