

Pharmacological curve fitting to analyze cutaneous adrenergic responses
- PMID: 21868682
- PMCID: PMC3233895
- DOI: 10.1152/japplphysiol.00780.2011
Pharmacological curve fitting to analyze cutaneous adrenergic responses
Abstract
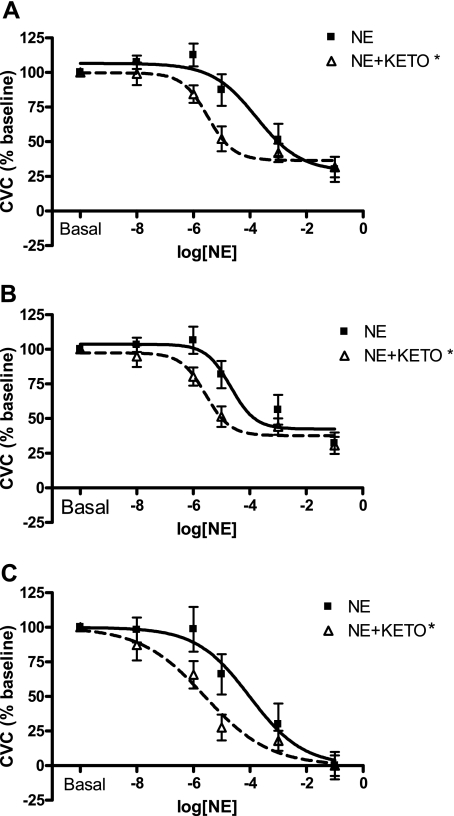
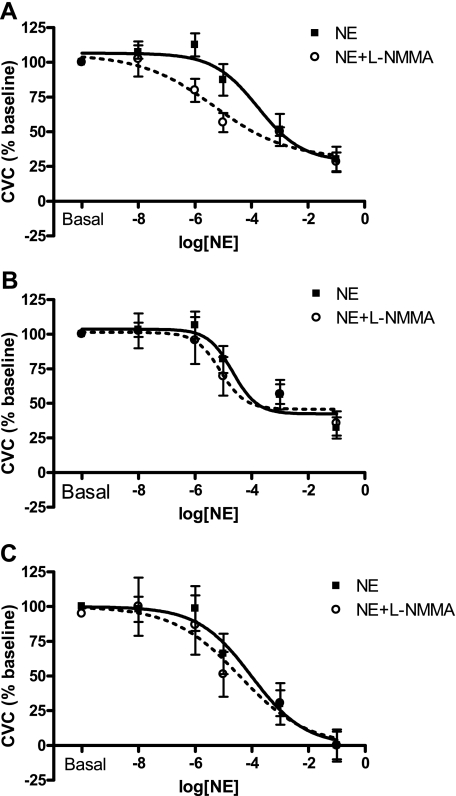
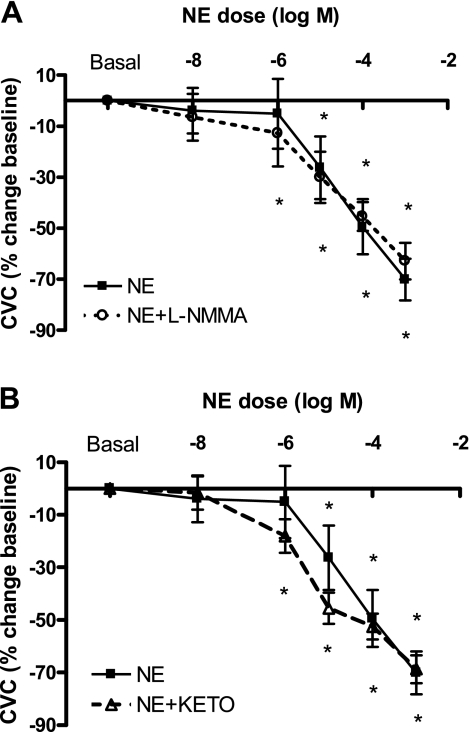
Although dose-response curves are commonly used to describe in vivo cutaneous α-adrenergic responses, modeling parameters and analyses methods are not consistent across studies. The goal of the present investigation was to compare three analysis methods for in vivo cutaneous vasoconstriction studies using one reference data set. Eight women (22 ± 1 yr, 24 ± 1 kg/m(2)) were instrumented with three cutaneous microdialysis probes for progressive norepinephrine (NE) infusions (1 × 10(-8), 1 × 10(-6), 1 × 10(-5), 1 × 10(-4), and 1 × 10(-3) logM). NE was infused alone, co-infused with NG-monomethyl-l-arginine (l-NMMA, 10 mM) or Ketorolac tromethamine (KETO, 10 mM). For each probe, dose-response curves were generated using three commonly reported analyses methods: 1) nonlinear modeling without data manipulation, 2) nonlinear modeling with data normalization and constraints, and 3) percent change from baseline without modeling. Not all data conformed to sigmoidal dose-response curves using analysis 1, whereas all subjects' curves were modeled using analysis 2. When analyzing only curves that fit the sigmoidal model, NE + KETO induced a leftward shift in ED(50) compared with NE alone with analyses 1 and 2 (F test, P < 0.05) but only tended to shift the response leftward with analysis 3 (repeated-measures ANOVA, P = 0.08). Neither maximal vasoconstrictor capacity (E(max)) in analysis 1 nor %change CVC change from baseline in analysis 3 were altered by blocking agents. In conclusion, although the overall detection of curve shifts and interpretation was similar between the two modeling methods of curve fitting, analysis 2 produced more sigmoidal curves.
Figures
References
-
- Abularrage CJ, Sidawy AN, Aidinian G, Singh N, Weiswasser JM, Arora S. Evaluation of the microcirculation in vascular disease. J Vasc Surg 42: 574–581, 2005 - PubMed
-
- Cook DA, Bielkiewicz B. A computer-assisted technique for analysis and comparison of dose-response curves. J Pharmacol Methods 11: 77–89, 1984 - PubMed
-
- Crandall CG, Cui J, Wilson TE. Effects of heat stress on baroreflex function in humans. Acta Physiol Scand 177: 321–328, 2003 - PubMed
-
- Davison JL, Short DS, Wilson TE. Effect of local heating and vasodilation on the cutaneous venoarteriolar response. Clin Auton Res 14: 385–390, 2004 - PubMed
Publication types
MeSH terms
Substances
Grants and funding
LinkOut - more resources
Full Text Sources
Other Literature Sources