. 2012 Mar;19(3):440-50.
doi: 10.1038/cdd.2011.111. Epub 2011 Aug 26.

Hypoxia-inducible factor-2α regulates Fas-mediated chondrocyte apoptosis during osteoarthritic cartilage destruction

Affiliations

Hypoxia-inducible factor-2α regulates Fas-mediated chondrocyte apoptosis during osteoarthritic cartilage destruction

J-H Ryu et al. Cell Death Differ. 2012 Mar.

Abstract

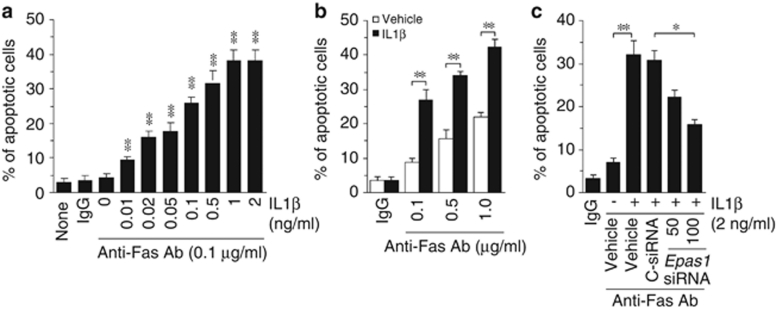
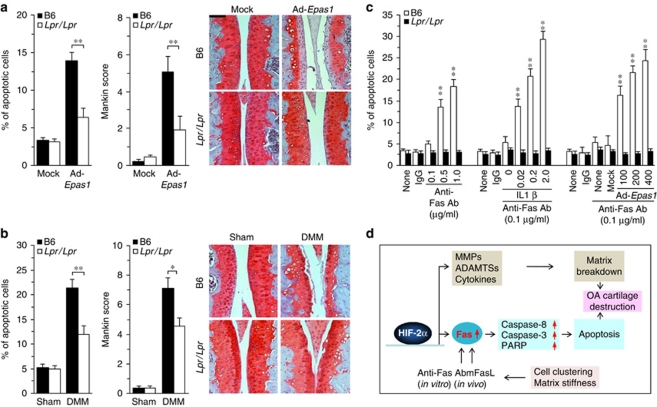
Apoptosis of articular chondrocytes is associated with the pathogenesis of osteoarthritis (OA). Recently, we demonstrated that hypoxia-inducible factor (HIF)-2α, encoded by Epas1, causes OA cartilage destruction by regulating the expression of various matrix-degrading enzymes. Here, we investigated the involvement of HIF-2α in chondrocyte apoptosis and OA cartilage destruction. HIF-2α levels in human and mouse OA chondrocytes were markedly elevated in association with increased apoptosis of articular chondrocytes. Overexpression or knockdown of HIF-2α alone did not cause chondrocyte apoptosis. However, HIF-2α expression markedly increased chondrocyte apoptosis in the presence of an agonistic anti-Fas (CD95) antibody. HIF-2α enhanced Fas expression and potentiated downstream signaling pathways, increasing the activity of initiator and executioner caspases. Overexpression of HIF-2α in mouse cartilage tissue, either by intra-articular injection of Epas1 adenovirus (Ad-Epas1) or in the context of chondrocyte-specific Epas1 transgenic mice, increased chondrocyte apoptosis and cartilage destruction. In contrast, chondrocyte-specific knockout of Epas1 in mice suppressed DMM (destabilization of the medial meniscus)-induced chondrocyte apoptosis and inhibited OA cartilage destruction. Moreover, Fas-deficient mice exhibited diminished chondrocyte apoptosis and OA cartilage destruction in response to Ad-Epas1 injection or DMM surgery. Taken together, our results demonstrate that HIF-2α potentiates Fas-mediated chondrocyte apoptosis, which is associated with OA cartilage destruction.


Figures

Figure 1
Figure 1
Chondrocyte apoptosis in human and mouse OA cartilage. (a) Sulfate proteoglycan and HIF-2α protein were detected by alcian blue and immunohistochemical staining, respectively, in normal cartilage, undamaged regions of OA cartilage, and OA-affected (damaged) human cartilage regions. Apoptotic chondrocytes were identified and quantified by TUNEL staining (n >7). (b) Cartilage destruction in 28-week-old STR/ort mice and control CBA mice was visualized by safranin O staining. HIF-2α protein was detected by immunostaining. Apoptotic chondrocytes were detected and quantified by TUNEL assay (n>6). (c) Cartilage destruction was determined by safranin O staining of knee joint cartilage after sham operation or DMM surgery. HIF-2α was detected by immunostaining. Apoptotic chondrocytes were detected and quantified by TUNEL assay (n>10). Values for apoptotic cells are presented as means±S.E.Ms. *P<0.01 and **P<0.001. Scale bar: 50 μm
Figure 2
Figure 2
HIF-2α stimulates anti-Fas antibody-induced chondrocytes apoptosis. (a) Primary cultured mouse articular chondrocytes were untreated, treated with IL1β (2 ng/ml), or infected at a multiplicity of infection (MOI) of 400 with empty Ad (Mock) or Ad-Epas1 for 24 h. Alternatively, cells were treated with anti-Fas antibody (1 μg/ml) for 6 h. Apoptotic chondrocytes were quantified by FACS analysis. (b) Surface expression of Fas in articular chondrocytes was determined by FACS analysis. (c) Articular chondrocytes were treated with IgG (1 μg/ml) or anti-Fas antibody for 6 h, and apoptotic chondrocytes were quantified by FACS analysis. (d) Chondrocytes were infected with empty Ad (Mock; 400 MOI) or Ad-Epas1 (at the indicated MOIs) for 24 h. The cells were incubated with anti-Fas antibody for an additional 6 h, and apoptotic chondrocytes were quantified. (e) Chondrocytes were infected with empty Ad (Mock) or Ad-Epas1 at an MOI of 400 for 24 h. The cells were treated with IgG (1 μg/ml) or anti-Fas antibody for 6 h, and apoptotic chondrocytes were quantified. Values in a, c, d, and e are presented as means±S.E.Ms. (n>10). *P<0.001 and **P<0.0005
Figure 3
Figure 3
HIF-2α mediates IL1β-induced stimulation of chondrocyte apoptosis. (a) Mouse articular chondrocytes were treated with the indicated amount of IL1β for 24 h. The cells were incubated with 0.1 μg/ml of IgG or anti-Fas antibody for an additional 6 h, and apoptotic chondrocytes were quantified. (b) Chondrocytes were untreated or treated with 2 ng/ml of IL1β for 24 h. The cells were then incubated with 1 μg/ml of IgG or anti-Fas antibody for an additional 6 h, and apoptotic chondrocytes were quantified. (c) Chondrocytes were transfected with 100 nM control siRNA (C-siRNA) or the indicated amounts (nM) of Epas1 siRNA. Following incubation for 12 h, the cells were treated with IL1β for 24 h and exposed to 0.1 μg/ml of IgG or anti-Fas antibody for an additional 6 h; apoptotic chondrocytes were quantified by FACS analysis. Values in ac are presented as means±S.E.Ms (n=8). *P<0.001 and **P<0.0005
Figure 4
Figure 4
HIF-2α regulates chondrocyte apoptosis in OA cartilage. (a) Empty Ad (Mock) or Ad-Epas1 virus was injected into knee joints of C57BL/6 mice. After 2 weeks, mice were killed and cartilage sections were used for safranin O staining, HIF-2α detection, and TUNEL assay. Cartilage destruction was scored by Mankin's method and apoptotic chondrocytes were quantified by TUNEL assay (n=10). (b) Safranin O staining, immunohistochemical detection of HIF-2α, and TUNEL assay of cartilage sections from 45-week-old Epas1 TG or WT mice. Cartilage destruction was scored by Mankin's method and apoptotic chondrocytes were quantified by TUNEL assay (n=6). (c) Safranin O staining of cartilage sections from sham- and DMM-operated WT and Epas1+/− mice. Cartilage destruction was scored using Mankin's method (n=10). (d) HIF-2α and apoptotic chondrocytes were detected in WT and Epas1+/− mice. Quantitation of apoptotic cells is shown in the right panel (n=8). Values for Mankin scores and apoptotic cells are presented as means±S.E.Ms. of the indicated n's. *P<0.01 and **P<0.0001. Scale bar: 50 μm
Figure 5
Figure 5
Chondrocyte-specific CKO of Epas1 suppresses chondrocyte apoptosis and OA cartilage destruction. (a and b) Safranin O staining from control (Epas1fl/fl) and CKO mice following DMM surgery or sham operation. Scale bar: 100 μm. Cartilage destruction was scored by Mankin's method. Values are presented as means±S.E.Ms. (n=12) (a). HIF-2α and apoptotic chondrocytes were detected by immunohistochemical staining and TUNEL assay, respectively. Scale bar: 30 μm. Apoptotic cells were quantified by FACS analysis. Values are presented as means±S.E.Ms. (n=6) (b). (c and d) Primary cultures of articular chondrocytes isolated from Epas1 CKO mice and control Epas1fl/fl mice were treated with anti-Fas antibody for 6 h. Apoptotic cells were visualized by TUNEL assay and quantified by FACS analysis. Values are presented as means±S.E.Ms. (n=8) (c). Articular chondrocytes were treated with 2 ng/ml of IL1β for 24 h and 0.1 μg/ml of anti-Fas antibody for an additional 6 h. Apoptotic cells were visualized by TUNEL assay and quantified by FACS analysis. Values are presented as means±S.E.Ms. (n=6) (d). *P<0.005 and **P<0.0005
Figure 6
Figure 6
HIF-2α increases Fas expression in chondrocytes and OA cartilage. (a) Chondrocytes were infected with empty Ad (Mock; 400 multiplicity of infection (MOI)) or Ad-Epas1 (at the indicated MOIs) for 24 h (left) or treated with IL1β for 24 h (right). Epas1 and Fas transcript levels were quantified by qRT-PCR (n=6). (b) Surface expression of Fas in chondrocytes was detected by FACS analysis in cells infected with Ad-Epas1 or treated with IL1β. (c) Chromatin immunoprecipitation assays for HIF-2α binding sites of the Fas promoter. Chondrocytes were left untreated (control), treated with IL1β (2 ng/ml), or infected with Ad-Epas1 at an MOI of 400. (d) Chondrocytes were infected with 100 nM control (C)-siRNA or Fas siRNA (at the indicated concentrations (nM)). The cells were infected with Ad-Epas1 (left) at an MOI of 400 or treated with IL1β (2 ng/ml) in the presence of anti-Fas antibody (0.1 μg/ml). Apoptotic cells were quantified by FACS (n=6). (e) Expression levels of Fas and Epas1 were quantified by qRT-PCR (n=8) in OA cartilage of STR/ort and control CBA mice, Ad (Mock)- or Ad-Epas1-injected mice, and sham- or DMM-operated WT and Epas1 CKO mice. Values for transcript levels and apoptotic cells are presented as means±S.E.Ms. of the indicated n's. *P<0.01 and **P<0.001
Figure 7
Figure 7
HIF-2α amplifies apoptotic signaling. (a and b) Mouse chondrocytes were treated with IgG (1 μg/ml) or with the indicated amounts (μg/ml) of anti-Fas antibody. Alternatively, the cells were treated with IL1β (ng/ml), empty Ad (Mock; 400 multiplicity of infection (MOI)) or with Ad-Epas1 (at the indicated MOIs) for 24 h, and incubated with 0.1 μg/ml anti-Fas antibody for an additional 6 h. Activities of caspase-8 (a) and caspase-3 (b) were measured using the respective assay kits. Values are presented as means±S.E.Ms. (*P<0.001; n=6). (c) Mouse articular chondrocytes were untreated or treated with the indicated amounts (ng/ml) of IL1β, or infected with empty Ad (Mock; 400 MOI) or Ad-Epas1 (at the indicated MOIs) for 24 h. The cells were exposed to 0.1 μg/ml of anti-Fas antibody for an additional 6 h. Both pro-forms and cleaved-forms of caspase-3, caspase-8, and PARP on the same blot were detected by western blot analysis using antibodies recognizing both forms
Figure 8
Figure 8
Fas-deficient mice exhibit markedly inhibited chondrocyte apoptosis and cartilage destruction. (a) Apoptotic chondrocytes were quantified by TUNEL assay in Fas-deficient C57BL/6-Lpr/Lpr mice (Lpr/Lpr) and C57BL/6 control mice (B6), after DMM and sham operations (n=9). Cartilage destruction was visualized by safranin O staining and quantified by Mankin's method (n=9). (b) Control (B6) and Lpr/Lpr mice were injected with empty Ad (Mock) or Ad-Epas1, and apoptotic chondrocytes were quantified (n=7). Cartilage was stained with safranin O, and destruction was scored by Makin's method (n=7). (c) Chondrocytes isolated from control (B6) and Lpr/Lpr mice were untreated, treated with IL1β (nM), or infected with empty Ad (Mock) or Ad-Epas1 at an MOI (multiplicity of infection) of 400. The cells were treated with normal IgG or the indicated concentrations of anti-Fas antibody, and apoptotic cells were quantified by FACS analysis (n=8). (d) Schematic diagram depicting HIF-2α regulation of chondrocytes apoptosis. Values in a, b, and c are presented as means±S.E.Ms. of the indicated n's. *P<0.01 and **P<0.001. Scale bar: 100 μm

Similar articles

Cited by

References

    1. Goldring MB, Goldring SR. Osteoarthritis. J Cell Physiol. 2007;213:626–634. - PubMed
    1. Hashimoto M, Nakasa T, Hikata T, Asahara H. Molecular network of cartilage homeostasis and osteoarthritis. Med Res Rev. 2008;28:464–481. - PubMed
    1. Kühn K, D'Lima DD, Hashimoto S, Lotz M. Cell death in cartilage. Osteoarthritis Cartilage. 2004;12:1–16. - PubMed
    1. Kim HA, Blanco FJ. Cell death and apoptosis in osteoarthritic cartilage. Curr Drug Targets. 2007;8:333–345. - PubMed
    1. Blanco FJ, Guitian R, Vazquez-Martul E, de Toro FJ, Galdo F. Osteoarthritis chondrocytes die by apoptosis. A possible pathway for osteoarthritis pathology. Arthritis Rheum. 1998;41:284–289. - PubMed

Publication types

MeSH terms

Substances