

An integrative genomics approach to biomarker discovery in breast cancer
- PMID: 21869864
- PMCID: PMC3153161
- DOI: 10.4137/CIN.S6837
An integrative genomics approach to biomarker discovery in breast cancer
Abstract
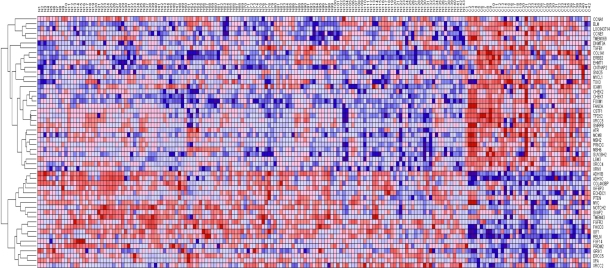
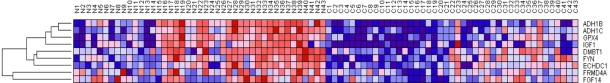
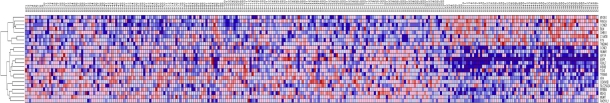
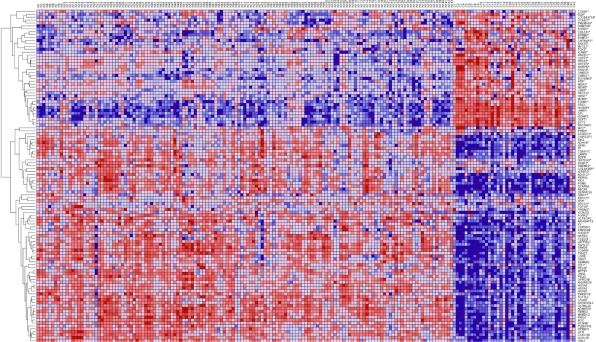
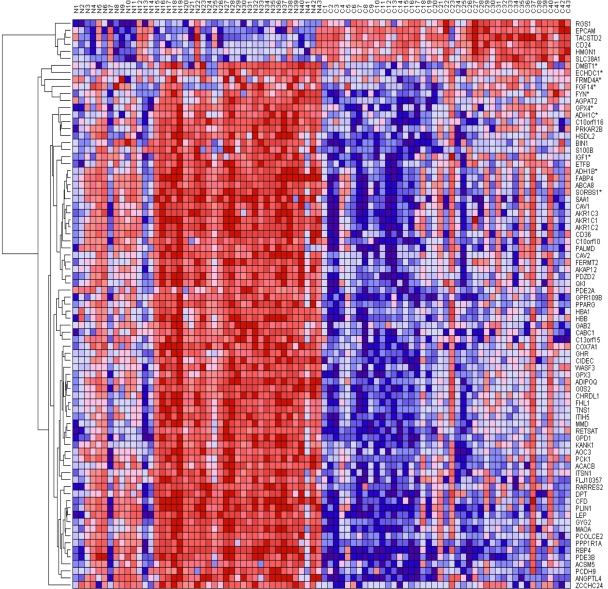
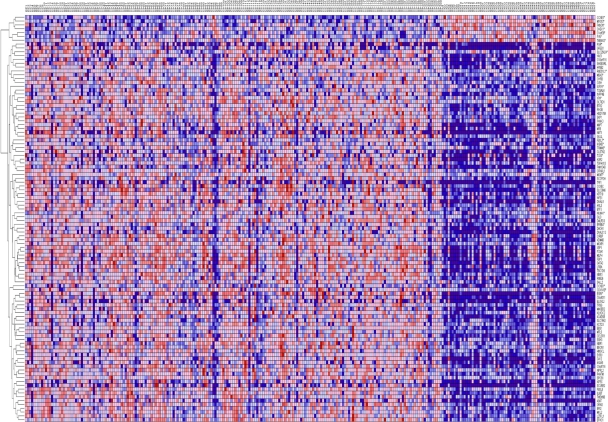
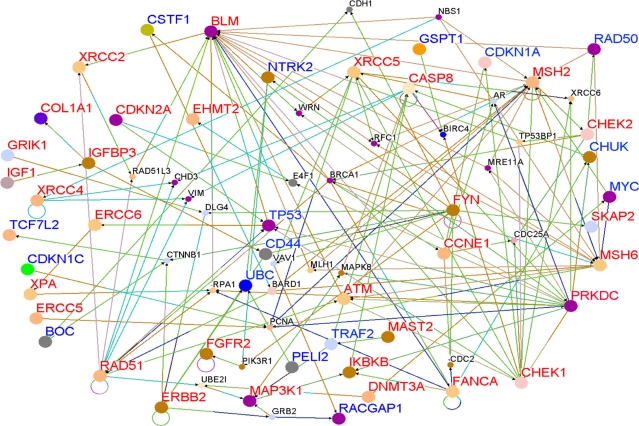
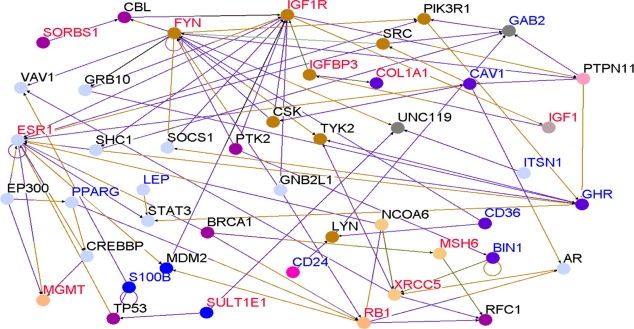
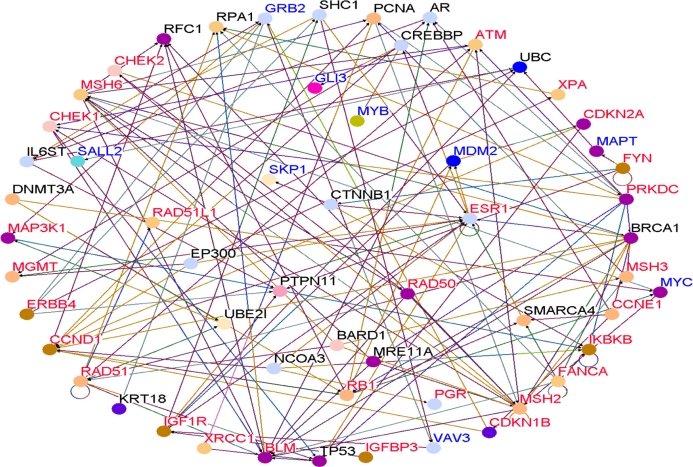
Genome-wide association studies (GWAS) have successfully identified genetic variants associated with risk for breast cancer. However, the molecular mechanisms through which the identified variants confer risk or influence phenotypic expression remains poorly understood. Here, we present a novel integrative genomics approach that combines GWAS information with gene expression data to assess the combined contribution of multiple genetic variants acting within genes and putative biological pathways, and to identify novel genes and biological pathways that could not be identified using traditional GWAS. The results show that genes containing SNPs associated with risk for breast cancer are functionally related and interact with each other in biological pathways relevant to breast cancer. Additionally, we identified novel genes that are co-expressed and interact with genes containing SNPs associated with breast cancer. Integrative analysis combining GWAS information with gene expression data provides functional bridges between GWAS findings and biological pathways involved in breast cancer.
Keywords: genome-wide association studies gene expression pathway.
Figures
Similar articles
-
Novel Integrative Genomics Approach for Associating GWAS Information with Intrinsic Subtypes of Breast Cancer.Cancer Inform. 2013 May 15;12:125-42. doi: 10.4137/CIN.S11452. Print 2013. Cancer Inform. 2013. PMID: 23761956 Free PMC article.
-
An Integrative Genomics Approach for Associating GWAS Information with Triple-Negative Breast Cancer.Cancer Inform. 2013;12:1-20. doi: 10.4137/CIN.S10413. Epub 2013 Jan 29. Cancer Inform. 2013. PMID: 23423317 Free PMC article.
-
Integrative genomic analysis for the discovery of biomarkers in prostate cancer.Biomark Insights. 2014 Jun 29;9:39-51. doi: 10.4137/BMI.S13729. eCollection 2014. Biomark Insights. 2014. PMID: 25057237 Free PMC article.
-
Critical Analysis of Genome-Wide Association Studies: Triple Negative Breast Cancer Quae Exempli Causa.Int J Mol Sci. 2020 Aug 14;21(16):5835. doi: 10.3390/ijms21165835. Int J Mol Sci. 2020. PMID: 32823908 Free PMC article. Review.
-
Elucidating the Underlying Functional Mechanisms of Breast Cancer Susceptibility Through Post-GWAS Analyses.Front Genet. 2018 Aug 2;9:280. doi: 10.3389/fgene.2018.00280. eCollection 2018. Front Genet. 2018. PMID: 30116257 Free PMC article. Review.
Cited by
-
Comprehensive assessment and network analysis of the emerging genetic susceptibility landscape of prostate cancer.Cancer Inform. 2013 Aug 28;12:175-91. doi: 10.4137/CIN.S12128. eCollection 2013. Cancer Inform. 2013. PMID: 24031161 Free PMC article.
-
Novel Integrative Genomics Approach for Associating GWAS Information with Intrinsic Subtypes of Breast Cancer.Cancer Inform. 2013 May 15;12:125-42. doi: 10.4137/CIN.S11452. Print 2013. Cancer Inform. 2013. PMID: 23761956 Free PMC article.
-
Neurobiology meets genomic science: the promise of human-induced pluripotent stem cells.Dev Psychopathol. 2012 Nov;24(4):1443-51. doi: 10.1017/S095457941200082X. Dev Psychopathol. 2012. PMID: 23062309 Free PMC article.
-
Resolving breast cancer heterogeneity by searching reliable protein cancer biomarkers in the breast fluid secretome.BMC Cancer. 2013 Jul 12;13:344. doi: 10.1186/1471-2407-13-344. BMC Cancer. 2013. PMID: 23849048 Free PMC article. Review.
-
An Integrative Genomics Approach for Associating GWAS Information with Triple-Negative Breast Cancer.Cancer Inform. 2013;12:1-20. doi: 10.4137/CIN.S10413. Epub 2013 Jan 29. Cancer Inform. 2013. PMID: 23423317 Free PMC article.
References
-
- Breast Cancer Facts and Figures 2009–10. American Cancer Society, Inc; 250 Williams Street, NW, Atlanta, GA: 30303.ic.
-
- Golub TR, Slonin DK, Tamayo P, Huard C, Gaasenbeek M, Mesirov JP, et al. Molecular classification of cancer: class discovery and class prediction by gene expression monitoring. Science. 1999;286:531–7. - PubMed
-
- Perou CM, Sorlie T, Eisen MB, et al. Molecular portraits of human breast tumours. Nature. 2000;406:747–52. - PubMed
-
- Van de Vijver MJ, He YD, van’t Veer LJ, et al. A gene expression signature as a predictor of survival in breast cancer. New Eng J Med. 2002;347(25):1999–2009. - PubMed
-
- Weigelt B, Hu Z, He X, et al. Molecular portraits and 70-gene prognosis signature are preserved throughout the metastatic process of breast cancer. Cancer Res. 2005;65(20):9155–8. - PubMed
LinkOut - more resources
Full Text Sources
Other Literature Sources
